From the Federal Reserve Bank of New York's Liberty Street Economics blog, July 6:
Elevated inflation continues to be a top-of-mind preoccupation for households, businesses, and policymakers. Why has the post-pandemic inflation proved so persistent? In a Liberty Street Economics post early in 2022, we introduced a measure designed to dissect the buildup of the inflationary pressures that emerged in mid-2021 and to understand where the sources of its persistence are. This measure, that we labeled Multivariate Core Trend (MCT) inflation analyzes whether inflation is short-lived or persistent, and whether it is concentrated in particular economic sectors or broad-based.
As we documented in a series of posts (most recently here), MCT inflation remained roughly stable through most of 2020 despite a visible drop in headline and core personal consumption expenditures (PCE) inflation due to the pandemic (see chart below). Early in 2021 the MCT estimate started to rise, ahead of core PCE inflation, and peaked in mid-2022. Its decline since then has been more notable starting in March of this year. Today we are updating the MCT estimates following the release of the May PCE data and we are launching “Multivariate Core Trend Inflation” as a standalone product, with new readings to be published each month on the New York Fed’s public website, after the Bureau of Economic Analysis (BEA) official releases.
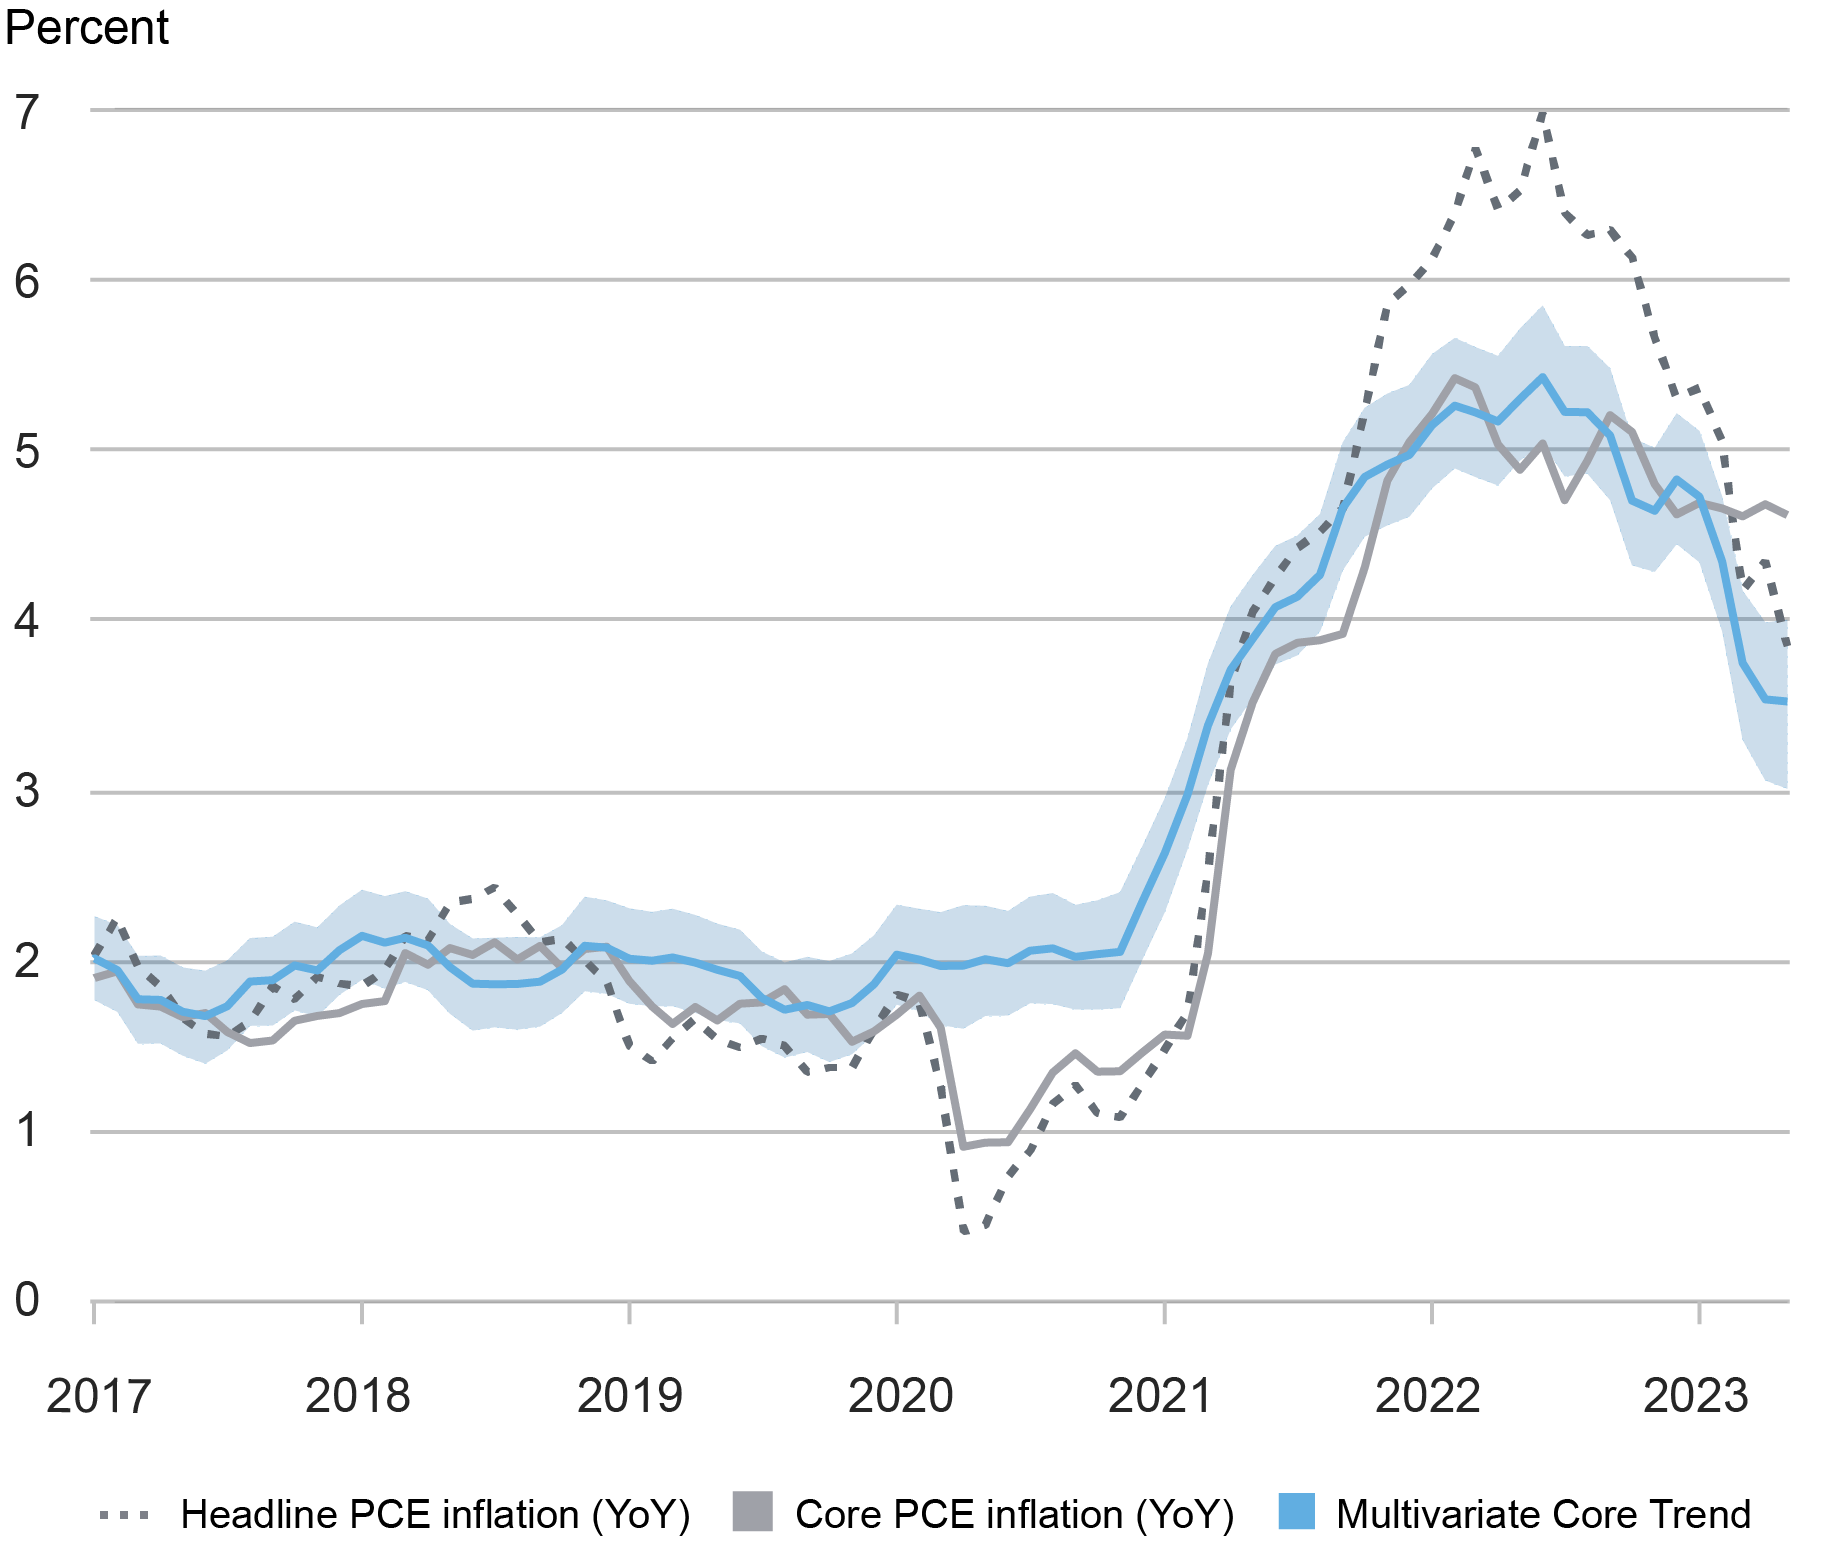
Sources: Bureau of Economic Analysis; authors’ calculations.
Bureau of Economic Analysis; authors’ calculations.
Methodology
The MCT measure is obtained by a dynamic factor model estimated on monthly data for the seventeen major sectors of the PCE price index. The approach (that builds on this paper) decomposes each sector’s inflation as the sum of a common trend, a sector-specific trend, a common transitory shock, and a sector-specific transitory shock. The trend in PCE inflation is constructed from the sectoral level estimates as the sum of the common and the sector-specific trends weighted by the expenditure shares. In the estimation, we use data from all seventeen of the PCE sectors; however, in constructing the trend in PCE inflation, we exclude the volatile non-core sectors (that is, food and energy).MCT and Core PCE Inflation
The Multivariate Core Trend model estimate stands at 3.5 percent in May, as in April, after experiencing a substantial moderation in the first part of the year. For reference, the twelve-month core PCE inflation rate is at 4.6 percent.Why is the MCT estimate so different from twelve-month core inflation rates? The MCT model measures the persistent component of month-on-month core inflation data as opposed to its twelve-month rate. This makes it timelier since transitory shocks tend to remain in the twelve-month measure for too long....
....MUCH MORE