Friday, July 31, 2020

Hurricane Isaias: Further West (Florida Landfall) and Weaker

The latest computer run using the European Centre for Medium-Range Weather Forecasts model, which has been among the most accurate models over the last few years.
First up, Ryan Maue (the keeper of the Accumulated Cyclone Energy table):

And from Weather.us:


That central pressure of 997 millibars is considerably weaker than yesterday's estimates in the 960's meaning an expected weak cat 1 rather than a high cat 2/low cat 3 = winds at 74mph vs 96 - 115 mph.

"Nvidia Reportedly in Talks to Buy Arm From SoftBank for Over $32B"

This would go a long way toward dethroning Intel as Chipzilla.

Eric Savitz at Barron's:
Published: July 31, 2020 at 11:29 a.m. ET 
There’s growing chatter that the graphics chip giant Nvidia is taking a serious run at buying the U.K.-based semiconductor design company Arm Holdings from SoftBank Group, which had acquired Arm in 2016 for $32 billion.

Both the Financial Times and Bloomberg are reporting that the two companies are in talks about a deal that would bring SoftBank (ticker: 9984.Japan) more than its original purchase price for the company. Earlier this month, there were multiple reports that SoftBank was considering a sale or initial public offering for Arm, and there is reason to believe that an IPO could value the company north of $40 billion. This is the second round of reports suggesting Nvidia (NVDA) might be a buyer, and the new reports don’t add much detail.

SoftBank, Nvidia, and Arm have declined to comment on the reports.

Arm doesn’t manufacture or sell chips—instead, the company creates processor designs that it then licenses to companies like Nvidia, Marvell Technology Group (MRVL), Broadcom (AVGO), and others. Arm-based processors power 95% of the world’s mobile phones and tablets. The company also designs processors for PCs.

Apple (AAPL) recently announced plans to shift its Mac personal computers to internally designed Arm-based chips and away from Intel (INTC) processors. An Nvidia acquisition of Arm would almost certainly bring objections from other licensees who view Nvidia as a competitor.
In announcing the Arm acquisition in 2016, SoftBank CEO Masayoshi Son said he expected the company to become a key driver in the Internet of Things (IoT), a major focus for the $100 billion SoftBank Vision Fund, a venture-capital portfolio launched the same year. Last year, Arm CEO Simon Segars told me in an interview that Arm was likely to return to the public markets in 2023....
....MORE

U.S. Wildfire Season Running Far Below Average

And if you go back, say 100 - 150 years the death toll and acres burned numbers are tiny (except for those who have lost a home, or a life)
Call it the "media center effect".
Every hurricane approaching New York City gets 24/7 coverage, every fire in the hills above Los Angeles is the hottest ever.

The classic example is Wisconsin's Great Peshtigo fire which started on the same day, October 8, 1871, as the Great Chicago Fire.

The Peshtigo fire, 250 miles north of the Chicago conflagration killed at least 1500, and more likely 2500, people while burning 1.2 million acres versus the Chicago toll of 2000 acres and 250 - 300 lives.

Unfortunately the fire season has months to run.
What follows are some historical comparisons* with a couple caveats:
1) the further back in time you go the less precise/reliable the size of the burn area. Death statistics tend to be more accurate.
2) Because of dramatic land use changes the dynamics of number of fires and extent have changed.As people move into formerly wild areas they cause a higher percentage of fires versus lightning. On the other hand fires that formerly burned until they ran out of fuel or until the rains came are now battled aggressively.
From the National Interagency Fire Center:
July 31, 2020
Nationally, 38 large fires have burned more than 196,000 acres across the country. Firefighters continue to make progress toward containment goals on many large fires in the West. Seven large fires were contained yesterday.

On July 30, two Single Engine Air Tankers on contract with the Department of the Interior crashed while assigned to the Bishop fire near Caliente, NV. Both pilots were fatally injured. The firefighting community extends condolences to the family and friends of the deceased.

Two MAFFS C-130 airtankers and support personnel from the 146th Airlift Wing (California Air National Guard) have been deployed to McClellan Airfield, CA, in support of wildland fire operations.

During this unprecedented time, the safety of the public and all wildland fire responders is always the number one priority for all wildland fire agencies. For more information and links to the Geographic Area Plans, visit the NIFC COVID-19 page.
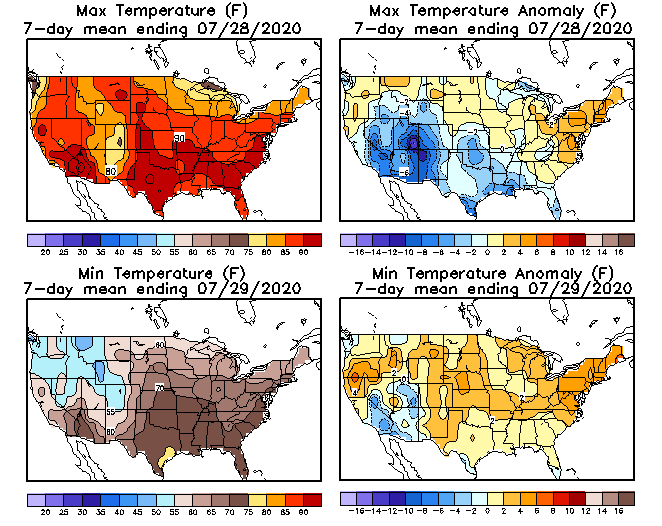
Weather
The Four Corners High will remain strongly amplified over the West. The near-record heat will continue across the Great Basin and the Pacific Northwest. Breezy conditions will develop along the Sierra Front in Nevada, creating critical fire weather conditions as it interacts with the usual low afternoon humidity. Widely scattered storms will be possible across the Okanogan and the western half of the Northern Rockies. Scattered convection will be possible across the northern Great Plains. The southwestern monsoon will remain suppressed due to the positioning and strength of the high pressure ridge that will remain anchored over Arizona. A stationary front will linger across the Carolinas, Tennessee River Valley and Texas, allowing for the redevelopment of scattered afternoon storms. Below normal temperatures are expected to continue across the Great Lakes region and New England, as a trough of low pressure remains over the region.....
*****

Year-to-date statistics
2020 (1/1/20 - 7/30/20) Fires: 31,632 Acres: 2,052,246
2019 (1/1/19 - 7/31/19) Fires: 25,501 Acres: 3,323,173
2018 (1/1/18 - 7/31/18) Fires: 37,718 ,Acres: 4,810,195
2017 (1/1/17 - 7/31/17) Fires: 39,000 Acres: 5,490,878
2016 (1/1/16 - 7/31/16) Fires: 33,852 Acres: 3,478,169
2015 (1/1/15 - 7/31/15) Fires: 35,931 Acres: 5,650,307
2014 (1/1/14 - 7/31/14) Fires: 33,437 Acres: 1,642,994
2013 (1/1/13 - 7/31/13) Fires: 27,841 Acres: 2,330,318
2012 (1/1/12 - 7/31/12) Fires: 37,355 Acres: 4,141,481
2011 (1/1/11 - 7/31/11) Fires: 45,632 Acres: 6,091,572
2010 (1/1/10 - 7/31/10) Fires: 37,267 Acres: 2,001,617
10-year average Year-to-Date
2010-2019 Fires: 35,247 Acres: 3,849,351
 
....MUCH MORE

*Total Wildland Fires and Acres (1926-2017) The National Interagency Coordination Center at NIFC compiles annual wildland fire statistics for federal and state agencies. This information is provided through Situation Reports, which have been in use for several decades. Prior to 1983, sources of these figures are not known, or cannot be confirmed, and were not derived from the current situation reporting process. As a result the figures prior to 1983 should not be compared to later data.
                       Year                      Fires                                                       .....Acres

1941 199,702 26,405,000
1940 195,427 25,848,000
1939 212,671 30,449,000
1938 232,229 33,815,000
1937 185,209 21,981,000
1936 226,285 43,207,000
1935 140,297 30,335,000
1934 162,663 41,821,000
1933 140,722 43,890,000
1932 166,399 42,063,000
1931 187,214 51,607,000
1930 190,980 52,266,000
1929 134,895 46,230,000
1928 175,934 43,542,000
1927 158,438 38,531,000
1926 91,793 24,316,000

Historically Significant Wildland Fires

Date Name Location Acres Significance
October 1871 Peshtigo Wisconsin and Michigan 3,780,000 1,500 lives lost in Wisconsin
1871 Great Chicago Illinois undetermined 250 lives lost
17,400 structures destroyed
September 1881 Lower Michigan Michigan 2,500,000 169 lives lost
3,000 structures destroyed
September 1894 Hinckley Minnesota 160,000 418 lives lost
September 1894 Wisconsin Wisconsin Several Million Undetermined, some lives lost
February 1898 Series of South Carolina fires South Carolina 3,000,000 Unconfirmed reports indicate 14 lives lost and numerous structures and sawmills destroyed
September 1902 Yacoult Washington and Oregon 1,000,000 + 38 lives lost
April 1903 Adirondack New York 637,000 Large amount of acreage burned
August 1910 Great Idaho Idaho and Montana 3,000,000 85 lives lost
October 1918 Cloquet-Moose Lake Minnesota 1,200,000 450 lives lost
38 communities destroyed
September 1923Giant Berkley Californiaundetermined624 structures destroyed and 50 city blocks were leveled

"How Low Can Yields Go?" (Cash Escape Inhibitors)

Moneyness addressed this question a year ago but first, Upfina, July 29:
The amount of negative yielding bonds is spiking again. There is $15.2 trillion in negative yielding bonds. 
 
The most important question in finance is the direction of the 10 year US treasury yield. Charlie Bilello did a Twitter poll where he asked if the 10 year yield would fall to 0% or rise to 3% first. To be fair, that poll is skewed since the yield is 58 basis points which is closer to 0%. Still, the fact that 82% of 2,592 voters said it will fall to 0% shows the sentiment is bullish on treasuries.

If you would have asked most people throughout history if the 10 year yield would ever fall to 0%, most would have predicted it wouldn’t. We asked on Twitter what the lowest possible 10 year yield could be. 33% of 189 voters said 0%, 28% said 2%, and 33% said there is no bottom. Theoretically, any asset can trade at any level. We saw oil briefly fall below zero which many thought could never happen. The futures market for the near term contract essentially broke, but we’re just showing how unusual things can happen. Nothing major happened when oil went negative because it was temporary and that situation resolved itself.
 
In theory, if yields fell deeply negative for a very short moment, nothing would happen. That’s not important. In an extended period, deeply negative yields would break the financial system causing some sort of Fed action. As yields keep falling, this extreme event becomes more probable (still unlikely). To be clear, if the 10 year yield fell to -5%, it would kill pensions, insurance companies, and force banks to charge for deposits which would be a disaster for the economy. Therefore, even though there is technically no limit to where any asset can go, the government would intervene in such an extreme scenario. The government would put a floor in yields. The current German 10 year bond yield is -51 basis points (record low -91 basis points). That hasn’t caused an extreme event which makes us think the U.S. 10 year yield could fall modestly negative without anything breaking.

Very Low Real Yields
The Fed and the government are already doing everything they can to boost nominal yields as the stimulus has been strong. They seem to be having a modest impact on inflation, but little impact on nominal yields which is why real yields keep hitting record lows. That has helped gold which hit $2,000 and is on a 9 day winning streak. If the government passes a fiscal stimulus soon, which helps the consumer, and COVID-19 cases continue to fall, we could see yields reverse as the bond market price in a cyclical recovery....
....MORE

And a repost from August 10, 2019:

"Cash Escape Inhibitors or How Low Can Negative Rates Actually Go?"
With talk of negative rates once again popping up in the U.S., and hardcore reality in Europe, it's time once again to ask the question, "How low can they go?"
First posted in March 2016
From Moneyness:

Central banks' shiny new tool: cash escape inhibitors
Negative interests rates are the shiny new thing that everyone wants to talk about. I hate to ruin a good plot line, but they're actually kind of boring; just conventional monetary policy except in negative rate space. Same old tool, different sign. 
What about the tiering mechanisms that have been introduced by the Bank of Japan, Swiss National Bank, and Danmarks Nationalbank? Aren't they new? The SNB, for instance, provides an exemption threshold whereby any amount of deposits that a bank holds above a certain amount is charged -0.75% but everything within the exemption incurs no penalty. As for the Bank of Japan, it has three tiers: reserves up to a certain level (the 'basic balance') are allowed to earn 0.1%, the next tier earns 0%, and all remaining reserves above that are docked -0.1%. 
But as Nick Rowe writes, negative rate tiers—which can be thought of as maximum allowed reserves—are simply the mirror image of minimum required reserves at positive rates. So tiering isn't an innovation, it's just the same old tool we learnt in Macro 101, except in reverse.
No, the novel tool that has been created is what I'm going to call a cash escape inhibitor. 
Consider this. When central bank deposit rates are positive, banks will try to minimize storage of 0%-yielding banknotes by converting them into deposits at the central bank. When rates fall into negative territory, banks do the opposite; they try to maximize storage of 0% banknote storage. Nothing novel here, just mirror images. 
But an asymmetry emerges. Central bankers don't care if banks minimize the storage of banknotes when rates are positive, but they do care about the maximization of paper storage at negative rates. After all, if banks escape from negative yielding central bank deposits into 0% yielding cash, this spells the end of monetary policy. Because once every bank holds only cash, the central bank has effectively lost its interest rate tool. 
If you really want to find something innovative in the shift from positive to negative rate territory, it's the mechanism that central bankers have instituted to inhibit the combined threat of mass paper storage and monetary policy impotence. Designed by the Swiss and recently adopted by the Bank of Japan, these cash escape inhibitors have no counterpart in positive rate land. 
The mechanics of cash escape inhibitors
Cash escape inhibitors delay the onset of mass paper storage by penalizing any bank that tries to replace their holdings of negative yielding central bank deposits with 0%-yielding cash. The best way to get a feel for how they work is through an example. Say a central bank has issued a total of $1000 in deposits, all of it held by banks. The central bank currently charges banks 0% on deposits. Let's assume that if banks choose to hold cash in their vaults they will face handling & storage costs of 0.9% a year. 
Our central bank, which uses tiering, now reduces deposit rates from 0% to -1%. The first tier of deposits, say $700, is protected from negative rates, but the second tier of $300 is docked 1%, or $3 a year. Banks can improve their position by converting the entire second tier, the penalized portion of deposits, into cash. Each $100 worth of deposits that is swapped into cash results in cost savings of 10 cents since the $0.90 that banks will incur on storage & handling is an improvement over the $1 in negative interest they would otherwise have to pay. Banks will very rapidly withdraw all their tier-2 deposits, monetary impotence being the result.  
To avoid this scenario, central banks can install a Swiss-style cash escape inhibitor. The way this mechanism works is that each additional deposit that banks convert into vault cash reduces the size of the first tier, or the shield, rather than the second tier, the exposed portion. So when rates are reduced to -1%, should banks try to evade this charge by converting $100 worth of deposits into vault cash they will only succeed in reducing the protected tier from $700 to $600, the second tier still containing the same $300 in penalized deposits. This evasion effort will only have made banks worse off. Not only will they still be paying $3 a year in negative interest but they will also be incurring an extra $0.90 in storage & handling ($100 more in vault cash x 0.9% storage costs). 
Continuing on, if the banks convert $200 worth of deposits into vault cash in order to avoid -1% interest rates, they end up worsening their position even more, accumulating $1.80 in storage & handling costs on top of $3.00 in interest. We can calculate the net loss that the inhibitor imposes on banks for each quantity of deposits converted into vault cash and plot it:

The yearly cost of holding various quantities of cash at a -1% central bank deposit rate

Notice that the graph is kinked. When a bank has replaced $700 in deposits with cash, additional cash withdrawals actually reduce its costs. This is because once the first tier, the $700 shield, is used up, the next deposit conversion reduces the second tier, the exposed portion, and thus absolves the bank of paying interest costs. And since interest costs are larger than storage costs, overall costs decline. 

If banks go all-out and cash in the full $1000 in deposits, this allows them to completely avoid the negative rate penalty. However, as the chart above shows, storage & handling costs come out to $9 per year ($1000 x 0.9%), much more than the $3 banks would bear if they simply maintained their $300 position in -1% yielding deposits.  
So at -1% deposit rates and with a fully armed inhibitor installed, banks will choose the left most point on the chart—100% exposure to deposits. Mass cash conversion and monetary policy sterility has been avoided. 
How deep can rates go?
How powerful are these inhibitors? Specifically, how deep into negative rate territory can a central bank go before they start to be ineffective?  
Let's say our central banker reduces deposit rates to -2%. Banks must now pay $6 a year in interest ($300 x 2%). If banks convert all $1000 in deposits into cash, they will have to bear $9 in storage and handling costs, a more expensive option than remaining in deposits. So even at -2% rates, the cash inhibitor mechanism performs its task admirably.
If the central bank ratchets rates down to -3%, banks will now be paying $9 a year in interest ($300 x 3%). If they convert all $1000 in deposits into cash, they'll have to pay $9 in storage & handling. So at -3%, bankers will be indifferent between staying invested in deposits or converting into cash. If rates go down just a bit more, say to -3.1%, interest costs are now $9.30. A tipping point is reached and cash will be the cheaper option. Mass cash storage ensues, the cash escape inhibitor having lost its effectiveness.  
The chart below shows the costs faced by banks at various levels of cash holdings when rates fall to -3%. The extreme left and right options on the plot, $0 in cash or $1000, bear the same costs.
The yearly cost of holding various quantities of cash at a -3% central bank deposit rate
So without an inhibitor, the tipping point for mass cash storage and monetary policy impotence lies at -0.9%, the cost of storing & handling cash. With an inhibitor installed the tipping point is reduced to -3.1%. The lesson being that cash escape inhibitors allow for extremely negative interest rates, but they do run into a limit....MORE
Moneyness home 

Related, August 8 [2019]:
ICYMI: "Negative U.S. bond yields may become reality—PIMCO"

"Fed’s Assets Fall by $16 Billion, -$220 Billion Since June 10: Week 7 of Balance Sheet Shrinkage"

From Wolf Street, July 30: 

Repos are gone. Dollar liquidity swaps dropped further. SPVs fell to lowest since June 17. MBS dropped by $37 billion. Treasuries rose.
Week seven since peak balance sheet: Total assets on the Fed’s balance sheet for the week ended July 29, released this afternoon, fell by $16 billion from the prior week, to $6.95 trillion. Since June 10, when they’d hit $7.17 trillion, they have declined by $220 billion:

Repos are gone, week 4.

After the Fed made repurchase agreements less attractive in mid-June by raising the bid rate, they fell out of use, though the Fed is still offering them:

....MUCH MORE

EIA Natural Gas Weekly Update: Meh, With An Upward Bias

The most important paragraph of the entire report:
....According to Baker Hughes, for the week ending Tuesday, July 21, the natural gas rig count decreased by 3 to 68, the lowest level on record. The number of oil-directed rigs rose by 1 to 181. The total rig count decreased by 2, and it now stands at 251....
From the Energy Information Administration:
for week ending July 29, 2020   |  Release date:  July 30, 2020

.... Prices/Supply/Demand:
Prices rise at most locations. This report week (Wednesday, July 22 to Wednesday, July 29), the Henry Hub spot price rose 11¢ from a low of $1.64/MMBtu last Wednesday to $1.75/MMBtu yesterday. Temperatures were generally close to normal across the Lower 48 states, with warmer-than-normal temperatures across the eastern seaboard and upper Midwest. At the Chicago Citygate, the price increased 18¢ from a low of $1.61/MMBtu last Wednesday to a high of $1.79/MMBtu yesterday.
California prices are up. The price at PG&E Citygate in Northern California rose 21¢, up from $2.38/MMBtu last Wednesday to a high of $2.59/MMBtu yesterday. The price at SoCal Citygate in Southern California increased 84¢ from $1.76/MMBtu last Wednesday to $2.60/MMBtu yesterday. Genscape reports that on Tuesday SoCalGas began storage withdrawal restrictions at the Honor Rancho storage field. Genscape expects the withdrawal restrictions to last until September 19.
Northeast prices increase. At the Algonquin Citygate, which serves Boston-area consumers, the price went up 15¢ from $1.59/MMBtu last Wednesday to $1.74/MMBtu yesterday as New England experienced warmer-than-normal temperatures during the week. At the Transcontinental Pipeline Zone 6 trading point for New York City, the price increased 4¢ from $1.76/MMBtu last Wednesday to $1.80/MMBtu yesterday.
The Tennessee Zone 4 Marcellus spot price increased 5¢ from $1.15/MMBtu last Wednesday to $1.20/MMBtu yesterday. The price at Dominion South in southwest Pennsylvania rose 6¢ from $1.24/MMBtu last Wednesday to $1.30/MMBtu yesterday.
Permian Basin discount to the Henry Hub stays relatively flat. The price at the Waha Hub in West Texas, which is located near Permian Basin production activities, averaged $1.22/MMBtu last Wednesday, 42¢/MMBtu lower than the Henry Hub price. Yesterday, the price at the Waha Hub averaged a high of $1.32/MMBtu, 43¢/MMBtu lower than the Henry Hub price. On Monday, the price at the Waha Hub reached as low as $1.04/MMBtu as Hurricane Hanna made landfall over southern Texas on Saturday, bringing cooler air into the region that lowered power demand over the weekend. In addition, AEP Texas, one of the state’s largest electricity providers, reported nearly 200,000 customers were without power after the storm on Sunday morning, although power had been restored to most customers by Wednesday.
U.S. Southeast braces for Tropical Storm Isaias. Tropical Storm Isaias is expected to make landfall in Florida this coming Friday or Saturday. EIA's Energy Disruptions map shows hurricane-related map layers from the National Hurricane Center and EIA's map layers for energy-related infrastructure such as high-voltage transmission lines, power plants, and petroleum bulk terminals.

Supply rises slightly. According to data from IHS Markit, the average total supply of natural gas rose by 0.1% compared with the previous report week. Dry natural gas production grew by 0.2% compared with the previous report week. Average net imports from Canada decreased by 2.1% from last week.

Demand rises across all domestic sectors, with power generation reaching a summer high. Total U.S. consumption of natural gas rose by 0.9% compared with the previous report week, according to data from IHS Markit. Natural gas consumed for power generation climbed by 0.7% week over week, reaching 43.6 Bcf/d on Monday, the highest level so far in summer 2020. Industrial sector consumption increased by 1.3% week over week. In the residential and commercial sectors, consumption increased by 0.6%. Natural gas exports to Mexico decreased 0.9%.

U.S. LNG exports are flat week over week. Seven liquefied natural gas (LNG) vessels (two each from Cameron and Cove Point and one each from Corpus Christi, Sabine Pass, and Freeport) with a combined LNG-carrying capacity of 25 Bcf departed the United States between July 23 and July 29, 2020, according to shipping data provided by Marine Traffic.....
....MUCH MORE

Thursday, July 30, 2020

"China’s Xi Sets His Sights on Taiwan After Subduing Hong Kong"

If I were Taipei I'd be reading up on The Dam Busters.
And figure out who among the island's millions are working for Beijing.
Who can sabotage the power system? Who is relaying Taiwan's strategic plans?
Who can cripple the water treatment plants?

The Chinese had a spy running the San Francisco office of Senator Diane Feinstein for years, including when she was Chair of the Senate Intelligence Committee. If they could do that, right under the noses of Peter Strzok and the rest of the FBI counterintelligence/counterespionage peeps, you know the Taiwanese nomenklatura and technocratic elite is riddled with spooks.

A deep dive from Bloomberg Businessweek:
Ever since Mao Zedong triumphed in 1949, prompting his Nationalist enemies to flee to Taiwan, Communist Party leaders have bolstered their legitimacy to rule by taming rebellious corners of China’s vast periphery.

The quest to capture lost territory prompted Mao’s army to subdue Tibet, where cadres co-opted Buddhist monasteries and eventually built a railway that ensured well-supplied garrisons of troops across the Himalayan plateau. He also reclaimed Xinjiang in the far west, a Muslim desert region the size of Iran where Silk Road traders once crossed paths with Uighurs—who have now been reduced to about 30% of the population of their own homeland after millions of China’s dominant Han ethnicity moved in. After Mao’s death, Deng Xiaoping further helped restore China’s glory following the so-called century of humiliation when he negotiated the return of two cities lost to colonial powers. The U.K. handed over Hong Kong in 1997, and Portugal followed two years later with Macao.

Xi Jinping has consolidated control in all of these places since taking power in 2012 and bolstered Beijing’s hold on disputed reefs in the South China Sea. Most notably, he set up a vast police state in Xinjiang that sent Muslims en masse to reeducation camps, and just in July he imposed a sweeping national security law in Hong Kong aimed at stamping out dissent in a city that many in the West once hoped would spur China to embrace democracy.

Now fears are growing that Xi wants to cement his place alongside Mao and Deng by conquering Taiwan, a prize that’s eluded Communist Party leaders for decades. Joseph Wu, the foreign minister of the island’s democratic government, warned on July 22 that China “may look for excuses to start a war or conflict” after it suddenly stepped up incursions into Taiwan’s air defense identification zone, raising the risk of a collision that could escalate. “What China is doing now is continuing to ramp up preparedness to solve the Taiwan issue,” Wu said. “We are very concerned that China will target Taiwan now that the Hong Kong security law’s been passed.”

Worries are also growing in the U.S., where both parties are increasingly united in viewing China’s rise as a threat to the free world. On July 23, Secretary of State Michael Pompeo said “securing our freedoms from the Chinese Communist Party is the mission of our time,” and a Republican Party lawmaker even planned to propose a bill authorizing the president to respond with military force if China attacks Taiwan.

The U.S. had terminated its mutual defense treaty with Taiwan as part of the agreement to establish diplomatic ties with China in 1979 in the wake of Richard Nixon’s famous trip to Beijing. It replaced that with legislation authorizing the sale of weapons for Taiwan to “maintain a sufficient self-defense capability,” while stopping short of saying it would join a conflict.

Those defense sales have become an increasing point of tension with Beijing. China slapped sanctions on Lockheed Martin Corp. in July after the latest approval of weapons sales under President Donald Trump’s administration, which has included billions of dollars’ worth of F-16 fighter jets, tanks, and Stinger missiles. Nikki Haley, Trump’s former United Nations envoy, on July 21 called for sales of more high-tech equipment and a trade deal. “Protecting Taiwan from Chinese aggression is essential to preventing an outright conflict with Communist China,” Haley wrote in a Medium.com opinion piece that lauded Trump for regularly sending warships to the Taiwan Strait. “No one wants war. Yet by threatening Taiwan, Beijing is making the world less safe and a confrontation more likely.”

Of the many U.S.-China conflicts right now—from Huawei Technologies Co. to Hong Kong to the consulate closures—none is more dangerous over the long haul than that involving Taiwan. The Communist Party has threatened to invade the island ever since Chiang Kai-shek’s Nationalists fled China in 1949. In a speech in Beijing last year about the party’s policy toward Taiwan, Xi said, “We make no promise to renounce the use of force and reserve the option of taking all necessary means.” He declared that “China must and will be united, which is an inevitable requirement for the historical rejuvenation of the Chinese nation in the new era.”

How a war would play out is the subject of much debate. China’s population of 1.4 billion dwarfs Taiwan’s 23 million, and its total defense expenditures are estimated to be 25 times greater. Hu Xijin, the editor-in-chief of the Communist Party’s Global Times newspaper, said in July that China wants peace but “is fully capable of destroying all of Taiwan’s military installations within a few hours, before seizing the island shortly after.”

Yet researchers who’ve studied war preparations on both sides doubt it will be so easy. While the People’s Liberation Army would seek to bombard the island with missiles and cyberattacks to quickly neutralize Taiwanese forces before they could fight back, the chances of pulling off such a comprehensive surprise assault are slim, according to a 2017 paper by Michael Beckley, who’s advised the Pentagon and U.S. intelligence communities.

Any failure to immediately knock out Taiwan’s forces, he wrote, would allow the island to repel an amphibious invasion or sustained bombing campaign—even without the U.S. military. Taiwan has been building up asymmetric capabilities like mobile missile systems that could avoid detection, and a prolonged conflict that draws in the U.S. and its allies risks dire economic consequences that could backfire on the Communist Party. “Even if China’s prospects are better than I have suggested, the PLA clearly would have its hands full just dealing with Taiwan’s defenders,” Beckley wrote, referring to the People’s Liberation Army. “Consequently, the United States would only need to tip the scales of the battle to foil a Chinese invasion.”

Any military action would be catastrophic for the global economy in one crucial regard: Taiwan has more than 20% of the world’s microchip production, including Taiwan Semiconductor Manufacturing Corp., which briefly became the 10th most valuable company in the world on July 24 following reports speculating that Intel Corp., the largest U.S. chipmaker, might outsource its production to the company. TSMC is based in Hsinchu, less than 100 miles from China’s coast. A sudden disruption of the supply chain would resound everywhere, including the People’s Republic.

Even if it took over the island, Beijing would face a hostile population....
....MUCH MORE

As the song says:
Heard of a van that is loaded with weapons
Packed up and ready to go
Heard of some grave sites out by the highway
A place where nobody knows
The sound of gunfire off in the distance
I'm getting used to it now
Lived in a brownstone, I lived in the ghetto
I've lived all over this town

This ain't no party, this ain't no disco
This ain't no fooling around
No time for dancing, or lovey dovey
I ain't got time for that now....
Life During Wartime
 Talking Heads, 1979

Isaias Is Now A Hurricane

And spinning up earlier than even the advisory of just a few hours ago had it.
From the National Hurricane Center:

cone graphic

More tomorrow.

National Hurricane Center Now Forecasts Tropical Storm Isaias To Become A Hurricane

When we posted at 11:45 AM PST the storm winds were still forecast to remain below the category 1 threshold (74 mph) as Isaias headed north. That has now changed.
From the NHC:

cone graphic

Our guess was that it would be the very warm water off northern Georgia that turbocharged the storm but now the NHC has that occurring further south, just west of the Bahamas.
And possibly stronger than Cat. 1:
A central pressure as low as the 960's gets you to a high cat 2 or low cat 3 although nowhere near the record holders.
2015's Hurricane Patricia made landfall on the west coast of Mexico with central pressure having been measured at 880 mb and winds at 200 mph.
As noted in the outro from last month's "Could a hurricane lash Los Angeles? 80 years ago, this deadly storm came close":

....In late October 2015 one of the most amazing storms in recent history occurred:
"Stunning, historic, mind-blogging, and catastrophic: Hurricane Patrica Hits 200 mph"

National Hurricane Center: "...POTENTIALLY CATASTROPHIC HURRICANE PATRICIA MOVING NORTHWARD TOWARD LANDFALL IN SOUTHWESTERN MEXICO..."

The National Hurricane Center Calls Patricia "THE STRONGEST EASTERN NORTH PACIFIC HURRICANE ON RECORD."

Which were followed by:
The Astonishingly Light Damage Caused By Hurricane Patricia

Still, you have to respect those Pacific storms. Depending on where they form they can be not just powerful but huge:
https://upload.wikimedia.org/wikipedia/commons/4/4e/Typhoonsizes.jpghttps://www.scientificamerican.com/media/inline/earths-strongest-most-massive-storm-ever_3.jpg

That's 1979's super-typhoon Tip, a bit less than half the size of the contiguous United States.

Secondly they can develop very high wind speeds. In 1996 Severe Tropical Cyclone Olivia had a wind gust measured at 253mph, the world record non-tornadic wind speed. 

"Tech stocks set to lead market higher Friday after the big four post blowout earnings, QQQ gains 1%"

The thing to keep an eye on are rates, not equities.
Sometime in August we expect Treasury issuance to exceed Fed buying causing a backup in rates.
Current ten year: 0.5410%   -0.0380% .
Since the Fed can buy any amount they want, up to and including all issuance (and even all outstanding!), the mismatch will by definition have to be a deliberate decision, although it won't be communicated as such.

Right now equities are a distraction that will trade higher for a few weeks.

From CNBC:
Wall Street was primed for a market rally to end the week as some of the biggest tech stocks — Facebook, AmazonAlphabet and Apple — reported quarterly results that beat high expectations.

The Invesco QQQ Trust, which tracks the Nasdaq 100 index, jumped more than 1% in after-hours trading Thursday. The SPDR S&P 500 ETF Trust (SPY), which track the S&P 500, was up 0.9%.
Facebook shares rallied more than 7% after the bell as the social media giant posted revenue growth of 11% even amid the coronavirus pandemic slowdown. The company also issued stronger-than-expected sales guidance for the current quarter.

Amazon, meanwhile, traded 5.3% higher as the company saw its sales skyrocket during the coronavirus pandemic. Apple also reported a blowout quarter, with overall sales expanding by 11%. Apple also announced a 4-for-1 stock split.

“The numbers were amazing relative to expectations,” said Peter Boockvar, chief investment officer at Bleakley Advisory Group. “We’ll see after their conference calls what has been priced in and what hasn’t.”
Google-parent Alphabet also posted better-than-expected results, sending the stock up 0.4%. The stock’s performance was muted relative to the other Big Tech names as the company’s overall revenue decline in its history. Revenues for Google Cloud were also just below analyst expectations. 
With those gains, the four stocks were set to add about $200 billion to their total market cap, bringing it to more than $5 trillion
Big Tech has been the stalwart on Wall Street this year. Amazon and Apple are up 65.2% and 31%, respectively, in 2020. Facebook and Alphabet have risen more than 14% over that time period. ...
....MUCH MORE

Tropical Storm Isaias: This Is Where Prediction Gets Tricky

As the models shift the storm track from a run straight up the Florida peninsula east into the Atlantic the system will start to cross some warm (29°C/84°F) water off the northern Georgia/South Carolina border.
The National Hurricane Center has the storm remaining below the 74 mph wind speed that upgrades Isaias to a hurricane, should the system linger it will suck up peta-joules of energy, becoming a hurricane and leaving the only question to be how strong the recurve to the east will be.

From the NHC:

https://www.nhc.noaa.gov/storm_graphics/AT09/refresh/AL092020_5day_cone_no_line_and_wind+png/175432_5day_cone_no_line_and_wind.png

From meteorologist Ryan Maue:

EIA Natural Gas Storage Report

First up, the estimates going into the report via FX Empire:
...Natural Gas Intelligence (NGI) is reporting that Energy Aspects issued a preliminary estimate for an 18 Bcf injection for the week-ending July 24 in this week’s Energy Information Administration (EIA) storage report.
“Other predictions for Thursday’s EIA report have been pointing to an injection in the 20s Bcf range. A Bloomberg survey as of early Wednesday showed a median prediction of 23 Bcf based on six estimates ranging from 18 Bcf to 30 Bcf. NGI’s storage model predicted a build of 24 Bcf”,  Natural Gas Intelligence wrote.
The forecasts compared with a 56 Bcf build for the same week a year earlier and the five-year average injection of 33 Bcf, according to the EIA.
The averages of injection forecasts, if proven accurate, would mark the lowest weekly figure this summer and the lowest in a five-week string of sub-100 Bcf additions to gas stockpiles, NGI reported....
The report from the Energy Information Administration:
Working gas in storage was 3,241 Bcf as of Friday, July 24, 2020, according to EIA estimates. This represents a net increase of 26 Bcf from the previous week. Stocks were 626 Bcf higher than last year at this time and 429 Bcf above the five-year average of 2,812 Bcf. At 3,241 Bcf, total working gas is within the five-year historical range.  
 Working Gas in Underground Storage Compared with Five-Year Range  
Note: The shaded area indicates the range between the historical minimum and maximum values for the weekly series from 2015 through 2019. The dashed vertical lines indicate current and year-ago weekly periods.
And the price reaction via the CME (NYMEX):

https://www.tradingview.com/x/o7AdIbRh/

That is an overreaction and we are still looking for prices to move: first, through the triple (or multiple) top just below the $2.00 line and secondly, to a front month price of $3.50 later into the heating season.