Common Factors In Commodity and Asset Markets
From Econbrowser:
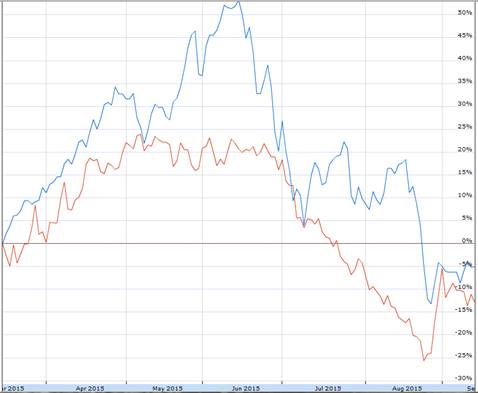
Increases in oil production in the United States and the Middle East were certainly key factors in the huge drop in oil prices over the last year. Nevertheless, one can’t help but be struck by the fact that the weekly changes in oil prices correlate with dramatic moves in other commodity and financial markets.
Cumulative percent change in Shanghai Stock Exchange Composite Index SHA (in blue)
and United States Oil Fund ETF USO (in red) since March 16.
For some time I’ve been summarizing global macro factors behind oil price movements by looking at the price of copper, the dollar exchange rate, and the interest rate. Here’s a regression of the weekly percent change in oil prices (as measured by 100 times the change in the natural logarithm of the price of a barrel of WTI) on the weekly percent change in copper prices, the weekly percent change in the trade-weighted value of the dollar, and the weekly change in the yield on a 10-year Treasury. The regression is estimated using data from April 2007 to June 2014 (right before oil prices began their spectacular decline). If in a given week copper prices rose, the dollar depreciated, and interest rates rose, then it’s likely oil prices rose that week as well. The regression can account for about a third of the variation in oil prices through June 2014.
Comparing September 4 values with those at the start of July 2014, copper is down 34.3% (logarithmically), the dollar is up 19.3%, and the 10-year yield is down 52 basis points. Based on the above regression, you’d expect we would have seen a 41.8% (logarithmic) decline in the price of crude oil, or that the price of oil would have fallen from $105 to $69. In fact on September 4 oil was at $46. So certainly more was going on than just changes in the broader global economy. But just as certainly, the latter played an important role in the slide of the price of oil.
The solid black line in the graph below plots the dollar price of WTI since the start of 2014, while the dotted blue line gives the price that is predicted by the above regression for each week since July 2014 based solely on what happened to copper prices, the exchange rate, and interest rates during that week....MORE