Tuesday, November 30, 2010

"Interpol Issues ‘Red Notice’ For Arrest Of WikiLeaks’ Julian Assange'"

From Wired's Threat Level blog:


The international police organization Interpol has issued a Red Notice for the arrest of WikiLeaks’ founder Julian Assange, in connection with a sex crime investigation in Sweden.

A Red Notice is kind of international wanted poster seeking the provisional arrest of a fugitive, with an eye towards extradition to the nation that issued the underlying arrest warrant. Interpol transmits the notices to its 188 member countries, including the U.K., where Assange is believed to be located. Interpol has no authority to compel a subject’s arrest. It issued 5,020 Red Notice last year for a variety of crimes.
A terse extract of Assange’s notice appeared on Interpol’s website on Tuesday, without a photograph, reporting that the 39-year-old Australian is wanted for “sex crimes” by the International Public Prosecution Office in Gothenburg, Sweden.

On November 18 a Swedish judge ordered Assange “detained in absentia” to answer questions in a rape, coercion and molestation investigation in Stockholm. A court approved an international arrest warrant for the ex-hacker two days later, and Sweden reportedly applied to Interpol for the Red Notice. Assange’s lawyer appealed the detention order to the Svea Court of Appeal, but lost. On Tuesday, Assange filed a new appeal to the Swedish Supreme Court.

The investigation stems from separate encounters Assange had with two women during his visit to Sweden last August, where he was applying for Swedish residency and attempting to secure the protection of Swedish free-press laws for his secret-spilling website. According to local news reports, the women told investigators the sexual encounters began as consensual, but turned non-consensual. One woman said Assange ignored her appeals to stop when the condom broke....MORE
Meanwhile:
Ecuador and Venezuela compete to praise WikiLeaks' Julian Assange
Venezuela I understand but Ecuador?

Another Insider Buys Citigroup in the Open Market (C)

Director Jerry A. Grundhofer bought 25,000 shares.
He's Chairman Emeritus and retired Chairman and CEO of U.S. Bancorp.
He knows a bit about banking.
He's also non-executive Chairman of the Board of Citibank, N.A.

On the downside he served as a Director of Lehman Brothers Holdings Inc. from April 2008 to March 13, 2009.
If I recall, something happened about 5 1/2 months into his term at LEH.

Here's the filing via SECForm4.com.
Previously:
Citigroup's Consumer Banking Chief Buys 542,098 Shares-Open-market (C)
See also:
The Inside Skinny On ISI Group's Citigroup Upgrade (C)

The Inside Skinny On ISI Group's Citigroup Upgrade (C)

From MarketBeat:

Citigroup Dividends: Could Return in 2012, Says Analyst
This caught our eye.
There’s been plenty of chatter about other financials, such as J.P. Morgan Chase, restarting shareholder payouts once the Federal Reserve determines bank cash cushions are fat enough.

But we hadn’t seen Citigroup specifically spotlighted in a note until today’s scribble from Edward Najarian at ISI Group. He upgraded Citigroup to “buy” from “hold,” citing a slew of reasons including improving credit quality, valuation and exposure to emerging markets....MORE

Hunt Consolidated Creates Two New Energy-linked REIT's, Getty Realty Pumps Gas and Yield (GTY; LUKOY)

First up, BloggingStocks: 
Getty Realty (GTY): Fill Up with Gas Station Gains
"Getty Realty Corp. (GTY), yielding 6.6%, is the largest publicly traded REIT which owns and leases gas stations and convenience stores," notes income specialist Carla Pasternak.


The editor of High Yield Investing explains, "The REIT has provided strong double-digit average returns of 11% annually over the past decade and a half (almost double the 6% for the S&P 500).
She continues, "It owns about 1,060 properties, mainly in the northeastern and mid-Atlantic state and operates nine petroleum distribution terminals.
"Getty was started in 1955 with one service station. The company went public in 1971 and spun off Getty Petroleum Marketing in 1997.

"That company was bought by Lukoil, Russia's largest integrated oil company. Lukoil's service stations currently lease 78% of Getty's properties. The other 22% are leased by individual operators.

"Getty has increased its distribution in small increments for six straight years. In 2004, the dividend was $0.425 cents a quarter.

"With the latest dividend increase in September, GTY is now paying out $0.48 a quarter or $1.92 per unit a year. At current prices, the REIT yields just over 6.6% ($1.92/$29.02).

"In 2009, well over 99% of the distributions came from ordinary income, taxable at your marginal income tax rate.
"Most of the balance was distributed from capital gains. As such, the REIT is best held in a tax-advantaged account.

"For the first nine months of 2010, adjusted funds from operations (AFFO) were $1.61 per unit. Getty uses this measure to calculate its dividend payout ratio.

"Of that amount, $1.35 per unit was distributed or about 83.8% of total AFFO. The payout ratio was down from roughly 90% in the year earlier period, and appears highly sustainable going forward.

"The dividend reinvestment plan is open to any shareholder of record. That means you must hold the units in your name and cannot be a 'beneficial' shareholder or hold the REIT through your broker.
"In addition to dividend reinvestment, shareholders can also purchase additional stock. If more stock is bought, the minimum amount must be $100 and the maximum allowed is $3,000 in a quarter.

"Getty's fortunes remain closely tied to those of Getty Petroleum Marketing, which provides about 80% of revenues.
"This division ensures steady rental income to Getty under long-term leases through 2015, which also provide for annual 2% rent increases.

"The stations haven't missed a single rent payment, but profit margins at the Marketing division tend to be volatile....MORE
And from the Dallas Morning News' Texas Energy and Environment blog:
Hunt creates first real estate investment trust for energy assets

Hunt Consolidated Inc. created two real estate investment trusts amounting to $2.1 billion, but not for the company's property arm.
The Hunt trusts will be the first real estate investment trusts to hold energy assets. One will hold electricity transmission infrastructure and the other will have natural gas pipelines.
The unique investment vehicle allows the company to avoid taxes. It could also draw fresh money into the utility sector at a time when the U.S. needs new transmission lines.
"We were challenged with determining a better way to allow investment to come into the infrastructure grid than currently exists," said Kirk Baker, president of Hunt's two new energy trusts. "I left that meeting and came back, and on my desk was a prospectus for a real estate investment trust. So I asked, why can't we do this?"
A real estate investment trust doesn't pay taxes, so long as it distributes its earnings to shareholders. The investors then pay taxes on their own earnings.
Baker had to get special permission from the Internal Revenue Service, but three years after he spied that prospectus, Baker is doing it.
Four other investors will put money into the Hunt trusts: Marubeni Corp., John Hancock Life Insurance, TIAA-CREF and OPTrust Private Markets Group.
The trusts will buy or build utility projects in Texas and other western states. Texas and the Great Plains states have seen growth in wind farm developments, which require new transmission lines. Hunt would like to build those lines.
"It's in the renewables breadbasket. Also demographically we think those areas will continue to grow," Baker said.
The trust will start by buying a stake in Sharyland Distribution and Transmission Services, a Hunt company that's building power lines in the Panhandle to carry wind power to North Texas. The trust aims to invest in or with other utilities, big and small....MORE
HT: Maril Hazlitt, PhD.
 
The Hunt REIT is not open to the public. For folks who don't know the Hunt family genealogy (picture Medusa's hair) Hunt Consolidated is the holding company for Hunt Oil Company, run by Ray Hunt, half-brother of Nelson Bunker who degraded the family crown jewel, Placid Oil, by way of a silver-induced madness bankruptcy back in the '80's.

In '92 Ray got into a bidding war with Ross Perot to buy Bunker's ranch. It was not sibling loyalty.

Climateer Line of the Day: Conspiracy Theory Edition

From a commenter at AboveTopSecret:

"There are 2 subjects on which I consider myself a bona fide expert: 
UFO’s and global warming...."

-from the post "Global Warming is not only NOT a hoax, but it is about 10,000 times worst than your worst nightmare"

Today's runner-up:
"Driving And Oxycontin Don't Mix"
Motor Trend's Todd Lassa responding to Rush Limbaugh's comments on MT's choice of the Chevrolet Volt as Car of the Year.

Hurricane season draws to a close, Insurers/Reinsurers Score Big (BRK.B; ALL; TRV)

From Wunderblog:
November 30 marks the final day of the 2010 Atlantic hurricane season--a strange and highly active season. While it was an exceptionally active year, with 19 named storms, 12 hurricanes, and 5 intense hurricanes, deaths and damages were far below what one would expect from so much activity. To me, this year is most memorable for what didn't happen--we did not get a full fledged hurricane rip through the Deepwater Horizon oil spill, nor did a devastating hurricane cause massive loss of life in Haiti's vulnerable earthquake zone. However, two hurricanes from this year are virtually certain to get their names retired--Tomas and Igor--and two other storms that did billions of damage to Mexico, Karl and Alex, are likely to have their names retired, as well.

The 19 named storms, 12 hurricanes, and 5 intense hurricanes were 198%, 203%, and 217% of the 1950-2000 average for named storms, hurricanes and major hurricanes, respectively. The nineteen named storms ties 2010 with 1995 and 1887 for 3rd place for most number of named storms in an Atlantic hurricane season. Only 2005 (28 named storms) and 1933 (21 named storms) were busier (Atlantic hurricane records go back to 1851, though there were likely many missed named storms prior to the beginning of satellite coverage in the mid-1960s.) This year also featured twelve hurricanes, tying 2010 with 1969 for second place for most hurricanes in a season. The record is held by 2005 with fifteen hurricanes. The five major hurricanes this year puts us in a tie for ninth place for most major hurricanes in a season. This year's Accumulated Cyclone Energy (ACE) index was 163, putting it in 13th place for ACE since 1944. A "hyperactive" hurricane season is considered to have an ACE index of >175% of the median. According to Wikipedia, median ACE measured over the period 1951–2000 for the Atlantic basin was 87.5, so 2010 is a hyperactive year by that definition (183% of the median.)


Friendly steering currents for the U.S.
As active as the 2010 season was, only one weak tropical storm made a direct landfall on the U.S. (Tropical Storm Bonnie, which hit South Florida in August as minimal tropical storm with 40 mph winds.) During the 15-year active hurricane period from 1995 - 2009, 33% of all named storms in the Atlantic hit the U.S., and 30% of all Atlantic hurricanes hit the U.S. at hurricane strength. Thus, the U.S. should have expected the landfall of six named storms, four of them being hurricanes, and two being intense hurricanes. So, the U.S. really lucked out this year. For comparison, here's how the U.S. fared in the four other hurricane seasons as busy or more busy:

2005: 28 storms, 7 hit the U.S. (5 were hurricanes, and 4 of those major huricanes)
1933: 21 storms, 7 hit the U.S. (5 were hurricanes, and 3 of those were major hurricanes)
1995: 19 storms, 5 hit the U.S. (2 were hurricanes, and 1 was major)
1887: 19 storms, 5 hit the U.S. (3 were hurricanes, no majors)

We had twelve hurricanes in the Atlantic in 2010, yet none of them struck the U.S. Since 1900 there is no precedent of an Atlantic hurricane season with ten or more hurricanes where none has struck the U.S. as a hurricane. The eleven previous seasons with ten or more hurricanes--1870, 1878, 1886, 1893, 1916, 1933, 1950, 1969, 1995, 1998, and 2005--each had at least two hurricane strikes on the U.S. Since hurricane Ike (2008), there have been eighteen consecutive non US-landfalling hurricanes. Such a sequence last happened between Irene (1999) and Lili (2002), with 22 consecutive non US-landfalling hurricanes, and between Allen (1980) and Alicia (1983) with seventeen consecutive non US-landfalling hurricanes (thanks go to Adam Lea of tropicalstormrisk.com for these stats.)

No major Category 3 and stronger hurricanes have hit the U.S. since Hurricane Wilma of 2005. This is just the third such major hurricane drought since 1851. The other two such 5-year major hurricane droughts were 1901 - 1905 and 1910 - 1914. Also, 2010 is the only year besides 1951 when there have been five major hurricanes in the Atlantic, and none have hit the U.S. (1958 is also listed as such a year, but preliminary results from a re-analysis effort shows that Hurricane Helene hit North Carolina as a major hurricane that year.) There has never been a six year period without a U.S. major hurricane landfall.

The reason the U.S. got so lucky--and that Canada and Mexico took a much more severe beating than usual--was that the Azores/Bermuda high was farther east than usual, and there were more strong troughs of low pressure over the U.S. East Coast than usual. In addition, there was stronger high pressure than usual over the U.S. Gulf Coast, which deflected Caribbean storms into Mexico....MORE
No U.S. landfalls. Just pocket those premiums and mosey on down the road.

"The 2012 sunspot sell-off"

I have some experience of this topic,* see below. The REAL date to watch for is 2022, in commodities anyway.
From FT Alphaville:
Sunspot market-cycle theory rears its scary head now and again.
(We wrote about it last in April 2009, for example — the prediction proved inaccurate, by the way.)
This time, though, it’s more worrying than usual since it’s beginning to tie itself with mystically predetermined “end of the world as we know it date” stuff.
(Yes, we did recently watch 2012, the Hollywood blockbuster, on Sky Movies.)
But it’s Daniel Shaffer, CEO of US-based Shaffer Asset Management and frequent contributor to Fox Business News, who is now making the sunspot related prediction. Although to be honest, we had never heard of him.
According to Reuters’ Natsuko Waki:
Shaffer writes that sunspot activities show that the sun has an approximate 11-year cycle and as of March 31, 2009, sunspot activity has reached a 100-year low (this, interestingly, coincides with a cycle low in equity markets, reached sometime mid-March in 2009).
But a low in solar activity seems to be followed by a high. Scientists are predicting a solar maximum of activity in sunspots in 2012 that could be the strongest in modern times, according to Shaffer.
“The concern is that something weird is going on and that the current extreme low in the sunspot cycle, similar to the stock market, can be followed by an unusually high sunspot cycle leading to a solar maximum, or in other words, a peak in sunspot activity,” he writes in his latest book.
But if you thought a peak in sun spot activity related to a fresh stock market high — you’d be wrong...MORE
*From "Wheat Market Gone Wild and "Do We All Die in 2027?":
During a misspent youth one of my follies was following in William Herschel's footsteps....
...And Herschel? In 1801 he announced** he had spotted a correlation between sunspots and wheat prices. Here's a mention in the Edinburgh Philosophical Journal, 1823.
The question has been argued for 200 years and Herschel has, off and on, been the subject of ridicule***. Here's a headline from the New York Times in 1903:
SUN SPOTS NO PROPHETS; Science Destroys Theories That Disasters Follow Their Appearance. Interesting as Solar Curiosities with Possible Relation to Electrical Conditions of Earth....Source
Here's the cached version
A while later I came on the scene, couldn't figure out how to make money out of Herschel's idea and having the attention span of a gnat, moved on. So why bring it up? Since I first looked at the matter there's been a lot of research and it appears the correlation may not be as spurious as I thought. The wheat price series is one of the longest we have, it extends back to 1250, I've got a paper chart that starts in 1300 (although some of the prices are dubious).

The CBOT has a wheat chart that starts in 1477.
Google Scholar has 285 ref's to Herschel and wheat prices. Gregory Yom Din of the Israel Cosmic Ray Center, Tel Aviv University and Israel Space Agency, seems particularly interested, here, here, here, and note below.
Or:
"Herschel and Me (Sunspots and Wheat)"

You can also peruse the work of William Stanley Jevons (he of the paradox):
 "The Solar Period and the Price of Corn" (1875)
"The Periodicity of Commercial Crises and Its Physical Explanation" (1878)
“Commercial crises and sun-spots”, Nature xix

You may want to dip into the big daddy of price series:
by J. E. Thorold‐Rogers, 7 volumes, 1866-1887 which probably influenced Jevons.

Here's another bit o'price series scholarship:


The paper constructs an annual price series for English net agricultural output in
the years 1200-1914 using 26 component series: wheat, barley, oats, rye, peas,
beans, potatoes, hops, straw, mustard seed, saffron, hay, beef, mutton, pork,
bacon, tallow, eggs, milk, cheese, butter, wool, firewood, timber, cider, and
honey. I also construct sub-series for arable, pasture and wood products. The
main innovation is in using a consistent method to form series from existing
published sources. But fresh archival data is also incorporated. The implications
of the movements of these series for agrarian history are explored.

"How cleantech VCs are reacting to the broken venture model"

From Greentech:
In many of my recent conversations with colleagues, there's a recurring theme: As a group, these investors are increasingly convinced that the traditional venture capital investment model as applied to cleantech hasn't been working.

In part, this is because there's increasing conviction among VCs and LPs across sectors that the venture capital model overall is broken and needs re-invention.  And in part, this is because the exit window has been so tough to hit for so many venture-backed startups across all sectors, over the past decade. So it's not just a cleantech thing.

But even so, with some exceptions the overall body of cleantech VCs I speak with do recognize that there are differences in energy, water and materials markets that mean the mid-2000s Silicon Valley approach to cleantech venture capital doesn't work.  To recap some of these which we've previously discussed on this site:

1. The investment models have been too focused on and accepting of capital intensity, without already knowing where the capacity-buildout / project finance capital would come from.

2. There's been too many investments done at valuations that reflect unrealistic growth expectations, unrealistic visions of the endgame being some "winner take all" scenario, and unrealistic hopes for huge IPOs instead of the more likely M&A exit.

3. Too much of a focus on proprietary IP, when so much of that IP is just defending one particular way of producing a commodity.

4. Too much of a focus on the technology, and not enough on the management team's ability to out-execute other teams.

5. Too much focus on just a handful of subsectors (solar, biofuels, transportation, building energy efficiency), when cleantech is really more an overarching investment thesis about looming natural resource scarcity, and thus more broadly applicable to a wider variety of subsectors.

6. Too much capital put in too early in the lifecycle of the company.  Putting in a ton of capital after the science risk is removed, under the expectation that now it's off to the races... but then finding that the path of successful productization, scale manufacturing, and commercialization will take longer than expected, which can be deadly when the company has been put into a high cashburn situation.

For all of these reasons, VCs who have invested into the cleantech sector are now talking to me and to each other about hard lessons learned from the past 5 years of investing.

What's interesting right now, however, is to see how differently many of these investors are reacting to these lessons.  If you think about it, there are really four basic ways to react to the realization that the traditional venture model as applied to cleantech isn't working.

- You can continue to beat your head against the wall anyway.  And there are certainly numerous investors out there doing just that.  They may talk about doing things differently, but at the end of the day their investments in 2011 will look much like their investments in 2007.

- You can narrow down your view of cleantech so that you're only investing in the sectors that look very much like other sectors you're more used to.  For example, narrowing down to only investing in internet and electronics-based sectors within cleantech.  And there are many investors, predominantly among the generalist VCs who had dabbled in cleantech, who are doing exactly this.  They don't want to say they're abandoning cleantech, but they do say they're really focusing on familiar-looking areas. Which helps partially explain the current high level of interest in "energy efficiency" as a category, because so much of that is IT-based.  This makes a lot of sense, but is kind of where most of the herd is headed right now, and also it's a bit unclear still how a "Netscape Moment" can emerge out of these investment categories.

- You can run screaming for the hills and abandon the category altogether.  And this is definitely happening across the generalist venture landscape as well.  Rarely is it being done overtly, but in many cases it's been a quiet retreat as cleantech teams get purged from big-named generalist venture firms.  And it's happening to a lesser extent among LPs, although it's tough to tell how much of this is just due to a general pullback of LPs from venture capital altogether.  But the net result is the same -- fewer specialist firms able to raise their next fund, and fewer cleantech specialists within generalist funds, so fewer cleantech venture investors overall....MORE

"Cowen’s Stone Maintains OUTPERFORM on Trina Solar, Sees 40% Upside (TSL)

From Small Cap Pulse:
Analyst Comments – Cowen’s Rob Stone maintained an OUTPERFORM rating on Trina Solar (NYSE:TSL) this morning after Trina reported Q310 financial results, noting that it is among the best-positioned PV names and sees 40% upside relative to the market in 12 months....MORE

Lithium: "JPMorgan Upgrades Sociedad Quimica y Minera (SQM) to Overweight, Raises Price Target ~65%" (SQM)

That kind of bump in the PT gets ones attention. The stock is trading down 66 cents at $51.25.
From StreetInsider:
JPMorgan upgraded Sociedad Quimica y Minera (NYSE: SQM) to an Overweight rating from its previous rating of Neutral. The firm also raised its price target on the company to $61 from $37.

For more ratings news on Sociedad Quimica y Minera click here and for the rating history of Sociedad Quimica y Minera click here.

Shares of Sociedad Quimica y Minera closed at $51.40 yesterday, with a 52 week range of $30.98-$52.71.

"The financialisation of commodities"

We are adamantly opposed to any regulatory framework that ennobles consumables as an "asset class".
If the betting crowd wants a toy to play with, they can run gold up to their heart's content.
And don't get me started on Goldman and their long-only index "investors".
Speculators taking the other side of a commercial hedger perform a societal good, the so-called investors are akin to hoarders, a crime that many societies have deemed worthy of the death penalty.
From VoxEU:
In recent years, hundreds of billions of dollars of investment has flowed into commodities markets. This column describes why and how commodities markets have grown so rapidly and discusses some policy implications.

 Crude oil, copper, cotton, soybeans, and live cattle – a seemingly unrelated set of commodities – went through a synchronised boom and bust cycle between 2006 and 2008 (see Figure 1).
Figure 1. Commodity prices

This cycle has stimulated heated debate in policy circles about whether speculation caused unwarranted increases in the cost of energy and food and induced excessive price volatility. There are two opposing views.
  • One view puts the boom-and-bust cycle down to a simple matter of supply and demand.
According to Krugman (2008), Hamilton (2009), Kilian (2009), and others, the rapid growth of emerging economies such as China propelled the quick increase in world demand and caused commodity prices to soar before the summer of 2008. Prices later fell sharply as the world recession caused demand to fade.
  • The second view points to the large flow of investment into commodity indices.
According to a CFTC staff report (2008) and Masters (2008), the total value of various commodity index-related instruments purchased by institutional investors has increased from an estimated $15 billion in 2003 to at least $200 billion in mid-2008. A recent report by the US Senate Permanent Subcommittee on Investigations (2009) argues that the dramatic index investment flow had distorted prices of some commodities such as wheat.

The growth of commodities

To thoroughly assess the role of financial investors in commodities markets, it is important to recognise the economic transition of commodities markets precipitated by the rapid growth of commodity index investment. We examine this process in a recent working paper (Tang and Xiong 2010). There is ample evidence suggesting that commodities markets were partially segmented from outside markets prior to early 2000s. Bessembinder (1992) and de Roon et al. (2000) show that commodity prices provided risk premium for idiosyncratic commodity price risk; Gorton and Rouwenhorst (2006) find that commodities had little price co-movements with stocks; and Erb and Harvey (2006) show that commodities in different sectors had little price correlation with each other. By arguing that commodities offer a diversification benefit to portfolios of stocks and bonds, Goldman Sachs and other indexers managed to promote commodity futures as a new asset class for institutional investors in the early 2000s following the collapse of the equity market. As a result, billions of dollars of investment has gradually flowed into commodities markets....MUCH MORE
HT: FT Alphaville

Sun Shines on Trina Solar's Business, not the Stock (TSL; TAN)

UPDATE: "Cowen’s Stone Maintains OUTPERFORM on Trina Solar, Sees 40% Upside (TSL)"
Original post:
In early pre-market the stock is only up 11 cents at $24.00.
From Reuters:
UPDATE 1-Sun shines on Trina Solar Q3, outlook
* Sees Q4 shipment of 300 MW vs 291 MW in Q3
* Raises FY shipment view to 1 GW from 900-930 MW
* Q3 profit $1.08/ADS ve est $0.87/ADS
* Q3 sales up 103 pct at $508.3 mln vs est $420.6 mln

Nov 30 (Reuters) - Trina Solar Ltd's (TSL.N: Quote) quarterly result beat estimates as shipments more than doubled and margins improved, and the Chinese photovoltaic products maker forecast shiny days for the rest of 2010.

For October-December, Trina expects to ship about 300 megawatts (MW) of modules, higher than the 290.5 MW it shipped in the third quarter.
It also raised its full-year view to 1 gigawatt from 900-930 MW [ID:nASA015VF], as demand for solar products is driven by developers rushing deals ahead of cuts to renewable energy subsidies in key European markets.

Third-quarter profit more than doubled to $82.9 million, or $1.08 per American Depository Share (ADS), from $39.8 million, or 64 cents per ADS, a year ago.
Revenue more than doubled to $508.3 million....MORE
The Dow Jones headline is:

Trina Solar 3Q Net More Than Doubles; Shipments View Raised 
Trina Solar Ltd.'s (TSL) third-quarter profit more than doubled as revenue soared on surging shipments and higher margins.
Results topped expectations, and the Chinese solar-products maker raised its shipments view for the year to 1 gigawatt from 900 megawatts to 930 megawatts....
Here's the press release:
Trina Solar Announces Third Quarter 2010 Results

We'll be back with analyst comments this afternoon.

"Commodity Prices and Food Stocks" (HRL; HSY; K; KFT; PEP)

From Barron's Investors' Soapbox:

Janney Capital discusses the impact of grain and livestock prices on shares of PepsiCo, Hershey's, Hormel, and others.
Janney Capital Markets
THE MACRO OUTLOOK WAS mixed last week, with improved U.S. data (e.g., GDP, personal income/spending, initial jobless claims, consumer confidence) offset by the EU's sovereign debt crisis, Korean geopolitical tensions, China's monetary tightening, and weak U.S. home sales.
Food inputs rose as a result of steady Chinese demand and supply concerns due to La Nina, yet the dollar's strength (up 2.4% week-over- week) clouds the outlook.
The USDA maintained its Food consumer price index (CPI) targets for calendar-year 2010 (CY2010) (1-to-2%), with lower egg prices offsetting an increase in pork, and calendar-year 2011 (CY2011) (2-to-3%), despite higher inflation in fats and oils, and sugar and sweets.

The agency expects inflation to accelerate in fourth-quarter 2010 (4Q10) and the first-half of 2011 (1H11).
We expect this commodity push to provide near-term relief for retailers' margins and manufacturers' top lines and to restore historical competitive dynamics, advantaging cereal maker Ralcorp (ticker: RAH) rated at Buy) and snack-maker ( PepsiCo (PEP) (rated at Buy)) and disadvantaging meats and dairy makers Kraft (KFT) (rated at Neutral), and Dean Foods (DF) (rated at Neutral)).

Grain prices were boosted by La Nina and China: Corn (3.4% week-over-week (w/w), soybeans (3.1%), and wheat (SRW 0.6%, HRW 1.6%) all rose due to sustained Chinese demand (soybeans, corn) and increased crop concerns. China's soybean imports may rise 38% year-over-year (y/y) in fourth-quarter (Q4), despite its vigorous efforts to dampen commodity prices.
As a result of La Nina, dryness in South America (soybeans, corn) and the U.S. Midwest (wheat, corn) and wet weather in Australia (wheat) led the International Grains Council (IGC) hence to cut its corn output forecast by 0.5% despite rising supplies in Argentina and Ukraine.

While grain users are facing the most inflation next year, we expect the impact to be a net positive for the cereal category, as it should end the competitive intensity enabled by deflation and should be substantially offset by cost savings for Kellogg (K) (rated at Neutral) and General Mills (GIS) (rated at Neutral).
Proteins are slightly up as solid demand offsets looser inventories. Hogs prices rose 1.8% week-over-week, with cattle up 0.8% and chicken about flat, as strong holiday demand (beef packers increased 5.1% year-over-year ) and concerns that cold U.S. weather could restrict animal weights more than offset looser U.S. stockpiles (pork was down 7% year-over-year in October versus up 20% in September, beef was down 6% versus down 8%, and poultry was flat versus down 5%)and geopolitical tensions in Korea (South Korea is the fifth largest U.S. beef/veal buyer, and sixth largest for pork).
The USDA raised its pork CPI forecast by 50 basis points to 5%-to-6% this year as hog prices rose last month, while U.S. beef exports should remain strong as Australia's cattle prices stand at the highest in over four years.

Pork exports, however, continue to look soft, which could weigh on the cutout margin. Still, this margin remains well-above a year ago and continues to bolster Hormel's (HRL) (rated at Neutral) profits despite risks to its value-added margins, though its volume performance was laudable last quarter.
Natural gas surged 5.6% week-over-week as domestic inventories were tighter than expected (down six billion cubic feet (bcf) week-over-week versus flat consensus) and East Coast weather is expected to be colder than previously forecast.

Crude oil increased 2.9% week-over-week as an improved U.S. macro outlook outweighed the stronger dollar. Crude oil inventories unexpectedly expanded in the week ended Nov. 19 (up one million blue barrels versus a consensus of down two million) as imports rose 15% week-over-week.
Distillate stockpiles decreased by 0.5 million blue barrels, while motor gasoline stocks increased by 1.9 million with demand flat year-over-year.

U.S. sugar and cocoa soft, while world sugar pops. World sugar jumped 8.0% last week as concern mounted that lower output in Brazil, India, Australia, and Russia could result in an unexpected deficit next year.
U.S. sugar, however, declined by 0.7% week-over-week, and cocoa (declined by 2.5%) remained soft as rising exports in Nigeria (up 38% year-over-year, and the third largest producer in Africa) and Cameroon (up 18%, and fourth-largest more than offset geopolitical volatility in the Ivory Coast.

Hershey's (HSY) (rated at Neutral) fading price tailwind should lead to more normalized growth next year. Despite its 20% price-to-earnings (P/E) premium, the company's restored ad spend and strong cash flow should limit the downside.

--Jonathan Feeney

Also at Investors' Soapbox:
November 26
Real Estate Gloomy in the Sunshine State
November 24
Three Oil-Field-Services Stocks to Buy Now

"Corporate Profits: What the Current Level Tells Us About S&P 500 Returns Over the Next Five Years"

From Seeking Delta:
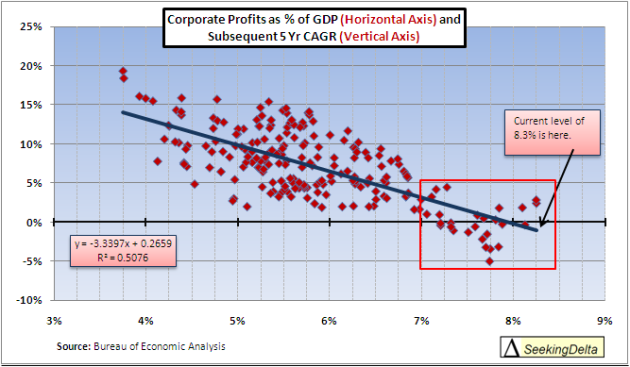
Last week, in his weekly market comment, John Hussman posted an interesting chart (see below) comparing the corporate profit to GDP ratio and the subsequent growth rate in corporate profits. I have previously posted on profit margins (see here and here) and will now further explore what profits margins at current levels imply about the next five years for the S&P 500 index.

But first a question: why is the current level of corporate profit margins so important?
When looking at the market through a P/E (Price divided by earnings) framework it becomes obvious that any price appreciation, by definition, must come from an expansion in the P/E multiple, an increase in earnings or both. Experts disagree on what, exactly cause an expansion or contraction in the P/E multiple but the general consensus is that it is due to the level of inflation, interest rates, investor sentiment or a combination of the three.
The current S&P 500 P/E multiple based on trailing twelve months earnings is 17.88; a level that is in the top 26% percent of monthly periods since 1900. The average multiple over that period is 15.68. Looking at the Shiller PE 10 or CAPE, the current multiple of 21.75 is higher than all but 18% (242 out of 1331, nearly half of which have occurred since 1999) of monthly occurrences. The post-1900 average for the CAPE is 16.29. Using either method, the current P/E multiple is above average historical levels. Based on this, it would appear auspiciously sanguine to count on a significant expansion in the multiple to drive returns. With multiples near the upper 20% of their historical range it is important to look at potential earnings growth as a source for price appreciation.

Earnings growth can come from two sources; economic growth and an expansion in the corporate profit margin. Economic growth, as measured by GDP, while certainly volatile from year to year has, over the longer term, remained fairly consistent. The general consensus seems to be that we are in for a period of average to below average growth so it would seem imprudent to count on returns from above trend growth in GDP. That brings us back to profit margins as a key driver of returns on a broad based index, in this case the S&P 500, over the next five years.
The following chart (click on any chart for a larger view) was posted by John Hussman in his November 15th market comment; I have recreated it for use here.

As can be seen in the chart (profit to GDP on right hand scale and 5 YR CARG inverted on the left had scale), the level of corporate profit to GDP is fairly indicative of the subsequent five year growth in profits. The correlation between the two metrics is -.73, which means that as corporate profits to GDP rise the subsequent growth in profits decline. Another way to analyze the data is through a scatter plot.


The current level of corporate profits, at 8.3% of GDP, is higher than the great majority of other periods. Furthermore, when profits are greater than 7% of GDP there are no examples of five year annualized profit growth at more than 5% (the box above).

Next we examine the percent change in the corporate profit ratio. Again, the subsequent change in the ratio is negatively correlated to the current level at -.58. Over the next five years based on the historical evidence we should expect the current profit ratio of 8.3% to decline.


With the negative correlation between present profit levels and future growth firmly established we move on to examining just what the current profit levels mean for future growth. See the next two tables that breakdown both the subsequent five year compound annual growth rate (CAGR) in corporate profits and the five year change in corporate profit to GDP ratio.
 Table 1 (Click to Enlarge)

 Table 2 (Click to Enlarge)

Looking at these tables it is clear that the annual growth in profit is highest when beginning at low profit margin levels. Furthermore, this high growth is primarily driven by an increase in the margin not by exceptional GDP growth. This is evidenced by the average change in margin percentage in Table 2.
...MORE

Related:
President Obama Has Been Very Good For Corporate America

Update to "President Obama Has Been Very Good for Business

Insurance/Reinsurance: "COMMENT: Risk modellers take flak"

We've been following the Florida insurance series for the last six weeks, links below.
Here's the article in question: "UPDATED: The Bogus Hurricane Models that Cost Florida Billions"
Here's a comment on it from the editor of Reactions magazine:
A scathing article that appeared in a Florida newspaper recently underlines that the market needs to stop taking risk models’ output as gospel, says Reactions' editor Michael Loney.

Read more: [risk management solutions] [rms karen clark] [karen clark & company]


Risk modelling firm Risk Management Solutions (RMS) was the subject of a scathing article in Florida’s Herald Tribune in November. The article said that following Hurricane Katrina in 2005 RMS aggressively pushed a new short-term model.

The lurid article, headlined “Florida insurers rely on dubious storm model”, stated: “RMS, a multimillion-dollar company that helps insurers estimate hurricane losses and other risks, brought four-hand picked scientists together in a Bermuda hotel room. There, on a Saturday in October 2005, the company gathered the justification it needed to rewrite hurricane risk. Instead of using 120 years of history to calculate the average number of storms each year, RMS used the scientists’ work as the basis for a new crystal ball, a computer model that would estimate storms for the next five years. The change created an $82bn gap between the money insurers had and what they needed, a hole they spent the next five years trying to fill with rate increases and policy cancellations.”

The article goes on to say that some hurricane specialists are now sceptical of RMS’ claimed “scientific consensus” for its new model. “Today, two of the four scientists present that day no longer support the hurricane estimates they helped generate,” the article says. “Neither do two other scientists involved in later revisions. One says that monkeys could do as well.”
The article adds that as a result of RMS’s model change the cost to insure a home in parts of Florida hit world-record levels.

(Full disclosure – Reactions and RMS share an ultimate parent in the Daily Mail & General Trust).
A number of points should be made in response to this article. Firstly, it is not risk modellers that set rates – insurance and reinsurance firms do that. Secondly, no one is forcing the reinsurance and reinsurance firms to use the RMS model. It is only one of several modelling firms. Thirdly, all the models were way off on Katrina, so the loss estimates were always going to increase (the question was by how much). Lastly, it is ludicrous to blame all of the rate increases after hurricane Katrina on a model change. Capital was depleted – the laws of demand and supply kicked in, pushing up pricing. The effects of model changes came on top of that.
The problem for RMS is the higher losses its new model predicted never came, making it look like the near-term model was not needed.

RMS responded in a letter to the editor of the Herald Tribune. It, not unreasonably, pointed out that the models merely deliver probabilistic forecasts not deterministic predictions. It also said that there is a widespread agreement among scientists that the number of North Atlantic hurricanes has increased since the 1970s and that since 1995 activity has been “significantly higher than the long-term average since 1900”. The question, RMS said, is how much higher is the frequency and how will it impact hurricanes making landfall in the US?

RMS said: “The scientists were deliberately kept at a distance from the commercial implications of the recommendations. In our annual review of medium-term activity rates (the next five years), we have worked with a total of 17 leading experts, representing a broad spectrum of opinions.”
It added: “There is no commercial advantage for us to overstate the risk.”

But the article does raise an important issue – the over-reliance of the industry on models. The Herald Tribune article stated: “RMS continues to promote its short-term model as the preferred option for its customers. A survey by Bermuda officials shows it is the dominant model for Bermuda reinsurers, the most crucial source of private hurricane protection for Florida.”
This is further evidence that insurers and reinsurers need to question what the models tell them. This is not the modellers’ fault. The models will never be perfect and they will always be wrong. Ironically, the models normally come in too low.
But equally, modellers should be careful not to overstate the accuracy of their models also. Karen Clark, CEO of risk modelling consulting firm Karen Clark & Company and founder of AIR Worldwide, an RMS rival, believes this is a problem. “I thought it was a pretty good article,” Clark told me after the Herald Tribune article came out. “I agree with the gist of what it was saying.”

Clark says three things were on the minds of insurance companies after Katrina: the industry had just had two years in a row of big cat losses; there was a sense that all models had been too low on Katrina; and there was a tremendous amount of press around Katrina, some even saying Katrina was caused by climate change.
“There was pressure to come out with models,” says Clark. “What happened is RMS came out with a near-term model that said over the next five years hurricane frequency would increase by 40%. That is fine if there is some science behind it to support an increase in frequency but quite another thing to say, OK, we throw out the model we have been using and move to the near-term one.”

Clark says too much emphasis was placed on the near-term model by RMS.

“They were kind of oversold,” says Clark. “It was money to real people. A small insurer may have to buy a lot more reinsurance and not be able to afford it. So the question is: is the science enough to justify it? A handful of scientists came up with that number and they never really had that use in mind for it.”
Clark says modellers overemphase the outcomes of their models, which can give answers down to the cent. She says the data behind the models is simply too uncertain to be that precise, and that a range should be provided instead....MORE
Previously: 
"Florida's Hurricane Insurance Premiums Largely Determined Overseas" 
"How Bermuda rigs insurance rates in Florida"

Monday, November 29, 2010

Just a Reminder: "Zeitgeist: Irish Republican Army Threatens to Shoot Bankers (Are you listening Wilbur Ross and Carlyle Group)"

A repost from September 15, 2010:

Ross and Carlyle will be fine, although this was today's WSJ headline "Wilbur Ross Sees Opportunities In UK, Irish Banks",
They, along with Dublin-based Cardinal Group are buying the Irish Education Savings Bank.

Private Equity firm Carlyle is the 11th largest defense contractor in the U.S. and could probably find a way to ruin some of those IRA fellows' day.
I'm guessing they wouldn't go to portfolio company Combined Systems for their less-than-lethal offerings.

That said, I should remind our City friends that pinstripes are not protective coloration. 
From: the Guardian:

Real IRA says it will target UK bankers

Exclusive: Republican terror group vows to resume mainland attacks with banks and bankers now potential targets
The IRA bombed targets in the City during the 1990s 
The IRA bombed targets in the City during the 1990s. 
Now the Real IRA may use the same tactic. 
Photograph: Rex Features 

Banks and bankers are now potential targets for the Real IRA, leaders of the dissident republican terror group have warned in an exclusive interview with the Guardian. Despite having only 100 activists they also said that targets in England remained a high priority.

In an attempt to tap into the intense hostility towards the banks on both sides of the Irish border they branded bankers as "criminals" and said: "We have a track record of attacking high-profile economic targets and financial institutions such as the City of London. The role of bankers and the institutions they serve in financing Britain's colonial and capitalist system has not gone unnoticed.

"Let's not forget that the bankers are the next-door neighbours of the politicians. Most people can see the picture: the bankers grease the politicians' palms, the politicians bail out the bankers with public funds, the bankers pay themselves fat bonuses and loan the money back to the public with interest. It's essentially a crime spree that benefits a social elite at the expense of many millions of victims."

But security sources in Northern Ireland point out say the Real IRA lacks the logistical resources of the Provisional IRA to prosecute a bombing campaign similar to the ones that devastated the City of London in the early 1990s or the Canary Wharf bomb in 1996. Although the Real IRA has access to explosives it has yet to carry out large-scale bombings....MORE
HT: Economic Policy Journal

Modern Economists Misinterpret Quantitative Easing

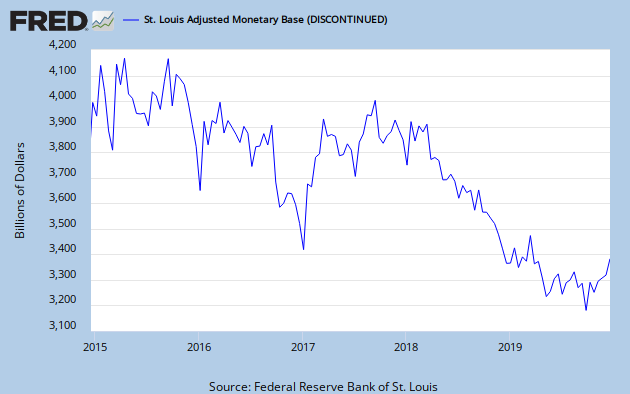
First up, the Federeral Reserve Bank of St. Louis:


FRED Graph

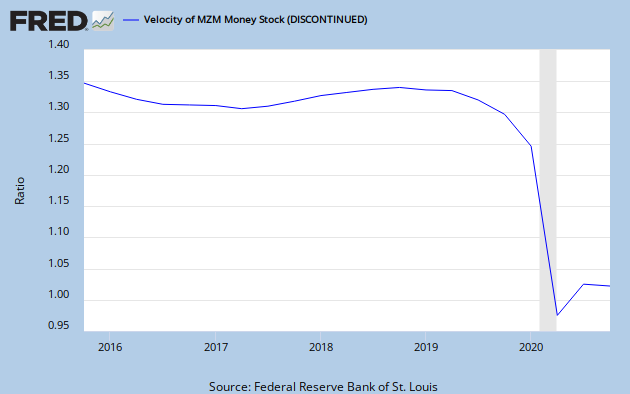
We like FRED. Here's the velocity of Money of Zero Maturity:

FRED Graph


Here's the headline story from MoneyNews:
If you are interested in promoting long-term, sustainable economic growth, I submit the velocity of money is more pertinent than the quantity of money (quantitative easing).

Apparently, many modern economists haven’t focused sufficiently on this economic parameter.

Simply stated, the velocity of money indicates how frequent monetary transactions occur. The same dollar, through multiple transactions, creates one dollar of income for multiple entities. Therefore, income can expand via numerous transactions while the monetary base (supply of physical currency, which excludes credit in the form of loans) remains constant. Hence, sustainable economic growth can be achieved with a stable supply of physical money.

The art is to create an environment that empowers monetary velocity to remain vibrant and grow.

The St. Louis Reserve Bank reports that monetary velocity fell 75 percent from mid-2008 to mid-2009, despite a 100 percent increase in the monetary base (from nearly $1 trillion to almost $2 trillion). An increase in the quantity of dollars is insufficient to generate the utilization of those dollars: they remain static in the form of excess reserves, available for transactions at some later date.

In 1978, MIT economist Nathan Mass developed a model to describe why excess liquidity in the form of monetary aggregates (capital) is insufficient in creating meaningful economic activity and growth. This scenario is referred to as the “liquidity trap.” He stated: “The weak impact of monetary stimulus on real activity arises because additional money has little force in stimulating additional capital investment during a period of general overcapacity.”

“Due to persistent excess capital, which cannot be reduced as fast as labor can be cut back to alleviate excess production, unemployment actually remains higher on the average following the drop in production."

Essentially, an increase in the monetary base exacerbates the overcapacity of capital. The excess supply of capital reduces its cost and provides less incentive to innovate and create investment opportunities. The excess monetary aggregates may be myopically consumed by endeavors with little future potential.

Ironically, higher borrowing costs (interest rates) provide additional incentive to generate more innovative, long-term investment opportunities. This enables an environment that fosters strong, sustainable economic growth (healthy transaction velocity with a more stable monetary base).

In analyzing a regression analysis of the monetary base and velocity in the United States, John Mauldin, president of Millennium Wave Advisors, demonstrates how a stable monetary base with nearly 0 percent growth can generate a growth in velocity and income of 6 percent (note: income equals quantity of money times velocity). The study also indicates that a percentage increase in the money base ironically causes a decrease in monetary velocity by an equal percentage. The net positive effect on economic growth is low, if any.

The same analysis for Japan is striking: it suggests a zero percentage gain in velocity with a stable monetary base of 0 percent growth. This reflects the ill-fated accommodative monetary policy in Japan for two decades, which solidified an intense liquidity trap. Monetary velocity for Japan would increase only if the monetary base contracts. Less available money may actually inspire innovative, entrepreneurial activity, which creates positive economic feedback: an environment that can sustain long-term growth.

The U.S. can avoid the liquidity-trap environment experienced in Japan by focusing less on the quantity of money (quantitative easing) and more on its velocity.

The Japanese phenomenon was unique in that quantitative easing (creation of monetary aggregates) was concurrent with a massive increase in debt issuance. During the U.S. depression of the 1930s, government debt as a percentage of GDP was reduced to 125 percent from 270 percent (a 50 percent decrease). However, total debt (private and public) in Japan tripled in the past two decades to 470 percent of income, according to a 2008 McKenzie study.

Debt issuance is highly inefficient in promoting economic growth. The level of debt required to generate a dollar of income quadrupled during the past four decades in the US: from $1.53 in 1960 to $6.00 in 2000. Moreover, studies by Dr. John Taylor, of Stanford University, suggest the velocity of money generated by government expenditures is roughly 50 percent of that for private expenditures, which translate to lower economic growth....MORE

"Goldman Joins MarketBeat as Box Watchers!" (GS)

I'm torn between the above and "Polygamous Lesbians Flee Sharia" as the headline of the day.
Here are the respective stories:
Die-hard MarketBeat addicts know that we get overly excited about ostensibly boring stuff around here. Staid dividend stocks? Check. Dusty digitized Wall Street Journal stories? Yep. And, of course, a topic that makes us tremulous with excitement: cardboard boxes....MORE
And:
A Nigerian lesbian who "married" four women last weekend in Kano State has gone into hiding from the Islamic police, with her partners.
 
Under Sharia law, adopted in the state seven years ago, homosexuality and same-sex marriages are outlawed and considered very serious offences.

The theatre where the elaborate wedding celebration was held on Sunday has been demolished by Kano city's authorities. ...MORE
(the latter is three years old but I was reminded of it for another post)

Citi Predictions for 2011

'Tis the season. Next week we'll do a recap of various 2010 prognostications and their accuracy.
In the meantime here's a running start on '11 via Barron's Stocks to Watch Today blog, I'll see if I can dig up the whole thing tonight:
A preview of a report by Citigroup (C) slated to be released later today has the firm predicting that the Federal Reserve, Bank of Japan and European Central Bank will all hold rates steady in 2011.

Citi says it expects the global economy to expand by 3.4% in 2011, and then accelerate to 3.8% in the year after. Much of this growth will be led by developing markets, especially Asia....

"Worst banking conspiracy ever" (ING; NBG; RBS et al)

This would be a laugh-riot if it weren't so serious.
From FT Alphaville:
Have you ever heard of Inter-Alpha? We hadn’t until this weekend, although we tend not to frequent the conspiracy sites that lump it in alongside the world’s Bilderbergs, Rothschilds, and the Stonecutters.
It is a group of banks that meet together to, erm, discuss stuff, but there’s no conspiracy. The truth is that Inter-Alpha’s list of members, are much, much more intriguing than that.

It’s basically a strong SELL list of European banks that’s been cleverly masquerading for years as an ‘ideas and experience’ talking shop:


See what we mean? What a coincidence of names. Put those in your pension portfolio and weep.
Inter-Alpha isn’t a conspiracy, or a talking shop. Inter-Alpha is like a bizarre nexus of everything — and we mean everything — that went wrong in European banking 2005-10, from subprime to sovereigns.
Consider this annotated list of Inter-Alpha member achievements:

Commerzbank — Subprime exposure, disastrous acquisition, 2008 blow-up, government capital injection, peripheral exposure*...MORE

A123 Update: Wunderlich Sees Slower Ramp of Electric Vehicles in U.S., Europe (AONE)

The stock is trading three cents off the day's low, at $8.00, down 8.13%.
Following up on this morning's quick hit, "A123 Systems (AONE) Shares Getting Whacked as Wunderlich Cuts to Sell" (AONE).
From TheStreet:
A123 Systems(AONE_) is experiencing heavy selling volume on Tuesday after Wunderlich Securities analyst Theodore O'Neill downgraded the lithium ion battery maker to a sell.

For some time already the Wunderlich analyst has been skeptical about the expected pace of electrical vehicle adoption and the ramp in the lithium ion battery makers' operations.

Inherent in the A123 Systems downgrade on Monday is Wunderlich's modeling of a slower ramp in the electrical vehicle business in both the U.S. and Europe. As a result, the Wunderlich analyst sees no choice for A123 Systems but to head back to the capital market to raise more money by early 2012 at the latest. The analyst is forecasting a cash balance for A123 Systems of less than $10 million by the end of 2012....MORE

"The Overlooked Gem Inside Citigroup" (C)

From the WSJ's Deal Journal blog:

AFP/Getty Images
Nomura bank analyst Glenn Schorr today turned peeks under the hood of Citigroup’s Global Transaction Services unit, which he calls the bank’s “least-understood and most-underappreciated business.”
Global transaction services include under-the-radar back office support services to help companies, the public sector and investment funds manage cash, trade financing and a raft of other financial transactions.
Schorr writes:
While the IB, Cards and Retail Banking get most of the attention, GTS is a $10bn-a-year revenue business with low capital requirements (just 6% of Citi’s assets reside here), generous 40-50% pretax margins, very attractive returns (ROAs of around 500bps), and is a critical source of liquidity for the rest of the Citi franchise (45% of the firm’s deposits are generated here)….
As few companies have GTS’s scale and cutting-edge platform, which is able to handle an increasingly complex and more global world, we think it can accumulate more market share and produce double-digit growth
Net income is spread out across the world, with about 16% from North America, one-third from Asia and one-third from Europe, the Middle East and Africa, according to the Nomura report. The GTS unit pulled in $9.79 billion of total revenue in 2009, according to financial reports, and net income of $3.7 billion....MORE
Previously:
Oct. 8 
Citigroup Poaches Nomura Energy Analysts, Nomura Retaliates by Initiating Coverage of Citi with a "BUY" (C; GS; MS; JPM)

We have so many posts on Citigroup it is probably easier to use the search blog box, keyword citi or citigroup. Here's one to note:
Citigroup's Consumer Banking Chief Buys 542,098 Shares-Open-market (C)

Updated: "A123 Systems (AONE) Shares Getting Whacked as Wunderlich Cuts to Sell" (AONE)

UPDATE: "A123 Update: Wunderlich Sees Slower Ramp of Electric Vehicles in U.S., Europe (AONE)"
Original post:
The stock is down 8.0% at $8.01.
From StreetInsider:
Shares of A123 Systems (NASDAQ: AONE) are tumbling this morning as we are hearing that an analyst at Wunderlich Securities has downgraded the stock from Hold to Sell. The firm cut its price target on AONE shares from $9 to $6....

Goldman Sees Euro as Both Dead and Alive Sticks With 12-Month $1.55 Call (EUR/USD) GS

Six days ago we posted "Unbelievable! Once Again Goldman Sachs' Foreign Exchange Team Gets it EXACTLY Wrong (EUR/USD) GS" with EUR/USD at 1.3486. An Irish bailout later we're at 1.3156 after trading as low as 1.3107.
Here's a twofer from ZeroHedge. First up, November 25, 2010:

Despite A Crumbling Europe, Goldman Sticks With Its 12 Month $1.55 EURUSD Forecast
Goldman's Thomas Stolper joins Erik Nielsen with an updated, and painfully bullish, Euro forecast: "our baseline is that these risks will not escalate much further." As Stolper is the guy who has successfully top.ticked.every.single.move in FX, it is time to call the undertaker (the profit margins on a coffin the size of Europe will be sufficiently high no matter the input cost of lumber).

Not surprisingly then Stolper follows up: "we believe EUR/$ remains very much on track for the projected trajectory of 1.40 in 3mths as well as 1.50 and 1.55 in 6 and 12 months." Recall that Stolper came out with his upward revised EURUSD forecast just before the pair topped out in the low 1.40s (which was shortly after he scrapped his 1.15 target just after the eurozone stopped its implosion last time around after the Stress Test lie and QE2 rumors started). In other words, we just doubled down on our bet that John Taylor is once again spot on. What is unsaid here is that Goldman expects the world to start pricing in QE3 imminently, and punish the USD: "one question we face very often is about the viability of Eurozone growth with EUR/$ at 1.55. Our answer is that we really believe in broad USD weakness."...MORE
And November 28th, 18:16:
The Euro Has Become Schrodinger's Money: Goldman Sees European Currency As Both Alive And Dead
It's time for a shirt: "Irish bondholders got a bailout and all the EURUSD managed was a measly 35 pips higher." It seems the currency vigilantes are calling the bluff in JC Trichet, and tomorrow Portuguese bonds will be next on the bidless brigade, further validating that the IMF's, just like the Fed's, primary mandate is to rescue insolvent bankers everywhere there is a taxpayer population that can be raped. But back to the EUR: at last check the currency was trading well inside 1.33, and only about 2.2k pips from Thomas Stolper's 12 month target of 1.55. Not to begrudge anything to Tom: after all, post QE4 he will certainly be spot on (the only question is how long it take Blackhawk Ben to get us there), but we wonder if another Goldman luminary got the memo. To wit: in an interview with the Telegraph, Jim "BRIC" O'Neill told Kamal Ahmad that "the eurozone must embark on a significant round of fiscal and political harmonisation if the euro is to survive...there are elements of the black swan concept that seem rather applicable to the EMU story" and if that wasn't clear enough, he added that the "euro should carry a "risk premium" and that it was over-valued by at least 10pc."

Bottom line, according to O'Neill the "fair value for the euro is €1.20 against the dollar and anyone buying it 10pc above that is not very sensible." Uh.... What? Did Wikileaks intercept the memo from Thomas Stolper sent out just this November 25, in which the chief currency strategist said: "Overall, we believe the EUR/$ remains very much on track for the projected trajectory of 1.40 in 3mths as well as  1.50  and 1.55 in 6 and 12 months." And like that, Goldman has all bases covered. Of course, seeing how the outcome is binary, Goldman has just discovered the Schrodinger currency: per the bank that rules the world, the euro is now both alive and dead at the same time.
As a reminder, here is what Stolper said 3 days ago...MUCH MORE
As we said in that Nov. 23 post:
...Here's the history of Goldman's Forex team over the last year:

August 31 
Currencies: "Is Goldman Preparing To Reevaluate Its EURUSD Target... Again?" (EUR/USD)
July 16, 2010 
"Goldman's FX Team Validates Cynical Critics, Capitulates On EURUSD Recommendation ONCE AGAIN" (EUR/USD)
June 10, 2010 
"Goldman Formally Lowers EURUSD Target From $1.35 To $1.15; Time To Go Long"(GS)
April 1, 2010 
Goldman Sachs on EUR/USD: "no freaking clue where the EUR will go next" (GS)
If you have an interest, plot the Goldman "research" against the EUR. It's got to be deliberate.

All that being said, the euro is oversold on a short term basis and could pop violently.
In the long run the euro is dead; the question is: can it last until it and the buck are replaced by some U.N. sanctioned world currency?
"And I, for one, welcome our new insect overlords"
-K. Brockman

First Solar, LDK, SunPower Get Some Love From ThinkEquity (FSLR; LDK; SPWRA)

In early pre-market trade FSLR is at $128.00 up $1.78. The 200-day moving average which stopped the stock last week is currently at $127.29. We'll see if the stock can hold the gains by the close.
Just a quick hit for now.
Via 24/7 Wall Street:

First Solar, Inc. (NASDAQ: FSLR) Raised to Buy and $148 target at ThinkEquity. 
LDK Solar Co., Ltd. (NYSE: LDK) Raised to Buy and $15 target at ThinkEquity. 
SunPower Corporation (NASDAQ: SPWRA) Raised to Buy and $20 target at ThinkEquity.


Sunday, November 28, 2010

"WHAT’S REALLY BEHIND QE2?"

Continuing our look at iconoclastic views of the Fed's intentions.
From Web of Debt:

The deficit hawks are circling, hovering over QE2, calling it just another inflationary bank bailout. But unlike QE1, QE2 is not about saving the banks. It’s about funding the federal deficit without increasing the interest tab, something that may be necessary in this gridlocked political climate just to keep the government functioning.
On November 15, the Wall Street Journal published an open letter to Fed Chairman Ben Bernanke from 23 noted economists, professors and fund managers, urging him to abandon his new “quantitative easing” policy called QE2. The letter said:
We believe the Federal Reserve’s large-scale asset purchase plan (so-called “quantitative easing”) should be reconsidered and discontinued. . . . The planned asset purchases risk currency debasement and inflation, and we do not think they will achieve the Fed’s objective of promoting employment.
The Pragmatic Capitalist (Cullen Roche) remarked:
Many of the people on this list have been warning about bond vigilantes while also comparing the USA to Greece for several years now. Of course, they’ve been terribly wrong and it is entirely due to the fact that they do not understand how the US monetary system works. . . . What’s unfortunate is that these are many of our best minds. These are the people driving the economic bus.
The deficit hawks say QE is massively inflationary; that it is responsible for soaring commodity prices here and abroad; that QE2 won’t work any better than an earlier scheme called QE1, which was less about stimulating the economy than about saving the banks; and that QE has caused the devaluation of the dollar, which is hurting foreign currencies and driving up prices abroad.
None of these contentions is true, as will be shown. They arise from a failure either to understand modern monetary mechanics (see links at The Pragmatic Capitalist and here) or to understand QE2, which is a different animal from QE1. QE2 is not about saving the banks, or devaluing the dollar, or saving the housing market. It is about saving the government from having to raise taxes or cut programs, and saving Americans from the austerity measures crippling the Irish and the Greeks; and for that, it may well be the most effective tool currently available. QE2 promotes employment by keeping the government in business. The government can then work on adding jobs.

The Looming Threat of a Crippling Debt Service

The federal debt has increased by more than 50% since 2006, due to a collapsed economy and the highly controversial decision to bail out the banks. By the end of 2009, the debt was up to $12.3 trillion; but the interest paid on it ($383 billion) was actually less than in 2006 ($406 billion), because interest rates had been pushed to extremely low levels. Interest now eats up nearly half the government’s income tax receipts, which are estimated at $899 billion for FY 2010. Of this, $414 billion will go to interest on the federal debt. If interest rates were to rise just a couple of percentage points, servicing the federal debt would consume over 100% of current income tax receipts, and taxes might have to be doubled.
As for the surging commodity and currency prices abroad, they are not the result of QE. They are largely the result of the U.S. dollar carry trade, which is the result of pressure to keep interest rates artificially low. Banks that can borrow at the very low fed funds rate (now 0.2%) can turn around and speculate abroad, reaping much higher returns.
Interest rates cannot be raised again to reasonable levels until the cost of servicing the federal debt is reduced; and today that can be done most expeditiously through QE2 -- “monetizing” the debt through the Federal Reserve, essentially interest-free. Alone among the government’s creditors, the Fed rebates the interest to the government after deducting its costs. In 2008, the Fed reported that it rebated 85% of its profits to the government. The interest rate on the 10-year government bonds the Fed is planning to buy is now 2.66%. Fifteen percent of 2.66% is the equivalent of a 0.4% interest rate, the best deal in town on long-term bonds.

A Reluctant Fed Steps Up to the Plate

The Fed was strong-armed into rebating its profits to the government in the 1960s, when Wright Patman, Chairman of the House Banking and Currency Committee, pushed to have the Fed nationalized. According to Congressman Jerry Voorhis in The Strange Case of Richard Milhous Nixon (1973):
As a direct result of logical and relentless agitation by members of Congress, led by Congressman Wright Patman as well as by other competent monetary experts, the Federal Reserve began to pay to the U.S. Treasury a considerable part of its earnings from interest on government securities. This was done without public notice and few people, even today, know that it is being done. It was done, quite obviously, as acknowledgment that the Federal Reserve Banks were acting on the one hand as a national bank of issue, creating the nation’s money, but on the other hand charging the nation interest on its own credit – which no true national bank of issue could conceivably, or with any show of justice, dare to do.
Voorhis went on, “But this is only part of the story. And the less discouraging part, at that. For where the commercial banks are concerned, there is no such repayment of the people’s money.” Commercial banks do not rebate the interest, said Voorhis, although they also “‘buy’ the bonds with newly created demand deposit entries on their books – nothing more.” ...MORE
We looked at the the debt service angle in "For My Republican/Conservative/Tea Party Friends: "Here is where all that Government Spending is Really Going" and "U.S. Government Debt Service to Surpass Military Outlays by 2016".

Some other thoughts on the Fed and QE2:

What on Earth is the Federal Reserve Doing? "...Saying One Thing But Doing Something Very Different"
"Is QE2 a Ruse by Bernanke?"
"Is QE2 A Stealthy $90 Billion Gifting Scheme To The Primary Dealers?" (BAC; C; GS; MS; JPM; HSB; UBS)
Paul Tudor Jones Questions Fed’s Bond Buying
George Soros, Henry Kissinger, China and QEII
"Tiny Cracks Forming in QE2 Trade?"
"Dave’s Top 10 Reasons Why QE Won’t Help the Economy"
"Dick Bove on QE2 as a bank-less “financial war with China”"
"ROBERT SHILLER DEBUNKS THE STOCK MARKET “WEALTH EFFECT”"