Chartology: Bank of America (BAC)
From
MPTrader via Market Oracle:
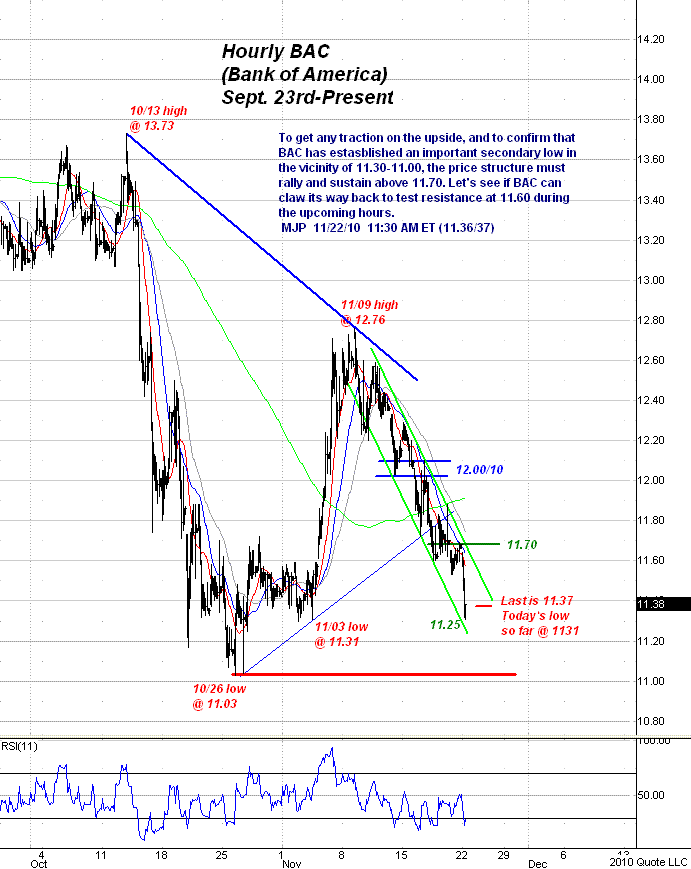
...The way the BAC pattern is unfolding on the downside, my work argues that all of the price action from mid-October through the present represents a major bottoming period for the stock.
To get any traction on the upside, and to confirm that BAC has established an important secondary low in the vicinity of 11.30 and 11.00, the price structure must rally and sustain above 11.70. Let's see if BAC can claw its way back to test resistance at 11.60 during the upcoming hours....

