albeit a stylish one, I look for reasons to not have money at risk.
Hence stuff like this from December 26th:
I know I've said more than once we are looking for 2250 (and probably a bit higher) on the S&P before the game changes, but this chart, with the lower lows and more importantly the lower highs, does not look promising for the immediate future:
We had no idea the headchoppers in Saudi Arabia would get the world's attention or that China would hit the circuit breaker but the market knew....something.
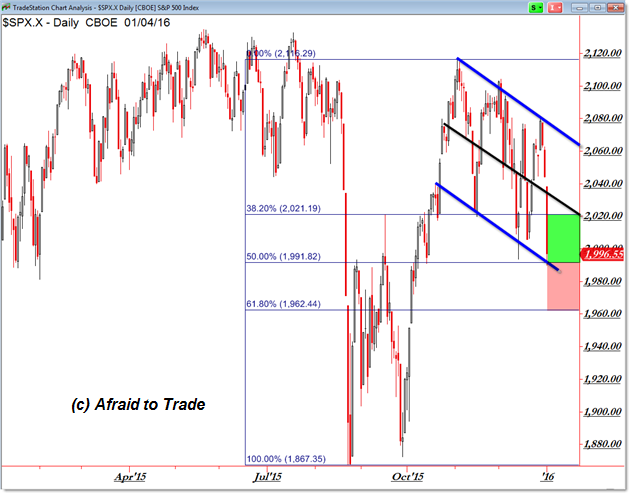
Here are some potential resting places from Afraid to Trade:
Big Price Action and Flag Targets for SP500
2016 begins with a big bang! Are you safe as we start the new year on a volatile note?
China’s stock market tumble spread globally which began 2016 on a bearish note.
Let’s quickly trace the “Flag” Trendline pivot points and targets and plan a quick strategy from the current chart.

Take a moment to reference my prior post “A Flat but Not Boring 2015” for additional commentary.DJIA 17,020.53 Down 404.50 (2.32%)
For now, we’re focusing on the 1,991 confluence level which is the overlap of the 50% Fibonacci Retracement and the lower “Flag” or falling parallel trendline channel trendline as drawn....MORE
S&P 500 1,996.99 Down 46.95(2.30%)