The Downward Spiral – Crude Price Rout Continues In Face of Stark Fundamentals
Crude prices have fallen 21% since the start of 2016 and may fall further with the end to Iranian sanctions threatening to release yet more supplies into a saturated market. The U.S. benchmark West Texas Intermediate (WTI) closed at $29.42/Bbl Friday (January 15, 2016) and is now down 78% since the price rout began in June 2014. What has changed in the past two months to make crude prices fall so fast this year? Today we begin a two-part discussion of the fundamental factors underlying current weakness in the crude market.
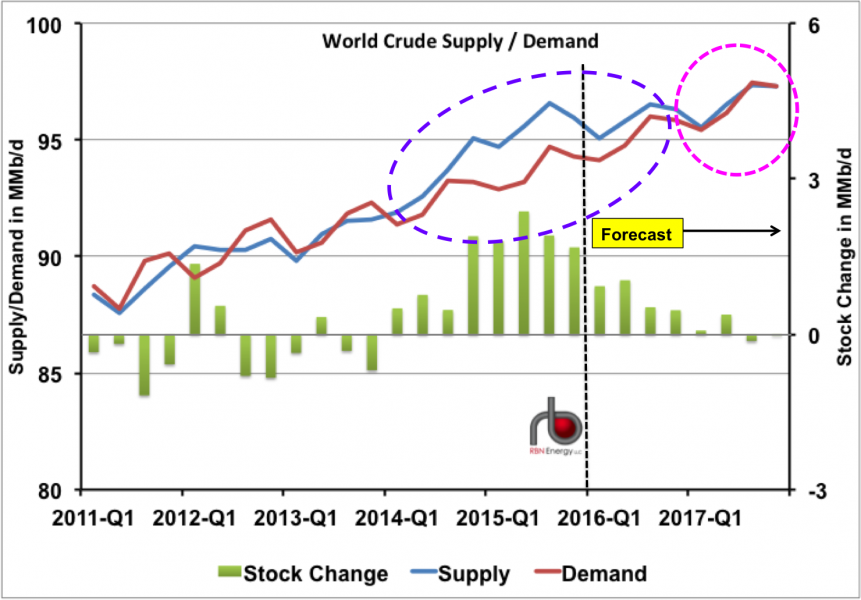
World Crude Supply/Demand
The latest short-term energy outlook (STEO) published this month (January 2016) by the Energy Information Administration (EIA) lays out the oversupply story underling current crude oil price weakness in its forecast out to the end of 2017. The data shows world crude production (supply) in Q1 2016 is still greater than demand – to the tune of about 0.9 MMb/d – meaning that surplus crude is adding to inventory stockpiles every day. Figure #1 charts the STEO actual and estimated world crude supply/demand data from 2011 through 2017. The blue line represents world crude production (left axis) and the red line is demand (left axis). During the period between 2011 and the start of 2014 demand kept ahead of supply (both growing about 4% a year) keeping world oil prices above $100/Bbl. Since 2014 the supply/demand balance has reversed with supply exceeding demand – leading to the price collapse in the second half of 2014 and continuing through today. The surplus of production over demand reached 2.4 MMb/d in Q2 2015. EIA expects the imbalance of production over demand to last until mid-2017 (purple dashed oval on the chart). The STEO predicts that world crude demand will once again exceed supply during the second half of 2017 (magenta dashed circle on the chart). The green bars on the chart represent stock change – or the difference between production and demand (against the right axis). If supply exceeds demand then crude is added to stocks (green bar is >0) and if demand exceeds production then the market draws from stocks
Market expectations that an end to Iranian sanctions will release another 0.5 MMb/d of crude onto the market as early as February 2016 are adding to the continued surplus fears. Although RBN expects domestic crude production to fall over the course of 2016 in the face of continued low prices (see our #10 Energy Prognostications for 2016) the latest four-week average field crude production (as reported by EIA on January 8, 2016) is still at 9.2 MMb/d – indicating that we still have not reached the point where producers have slowed down enough to make a difference.
...MORE
Here's the EIA's Short Term Energy Outlook.
We were going to post when it came out Jan. 12 but RBN takes more time digging into it.