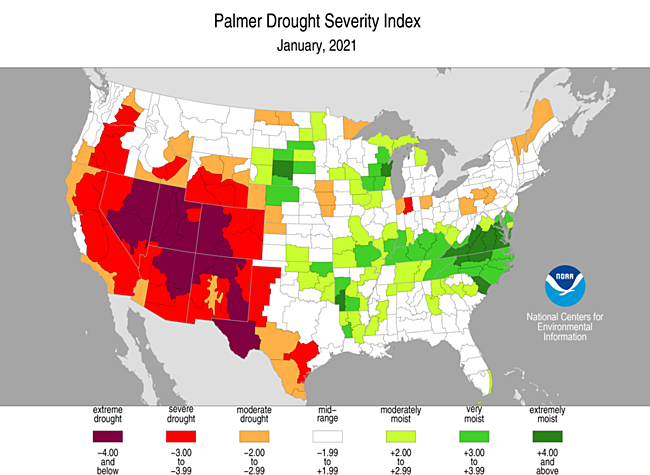
We usually do a comparison of the current Drought Monitor map and the map from four weeks earlier. Today though we will use an animation of the Palmer Drought Index which, due to a different methodology and presentation has shown some usefulness in evaluating agricultural conditions.
First up, the usual (current) map from the University of Nebraska at Lincoln:

And from NOAA the Palmer Drought Severity Index:

Click through for animation controls
Key takeaway: Don't build cities in the desert.
Las Vegas and Phoenix are already eyeing the Great Lakes as the population sucks up so much water from the Colorado river that the river no longer makes it to the ocean.