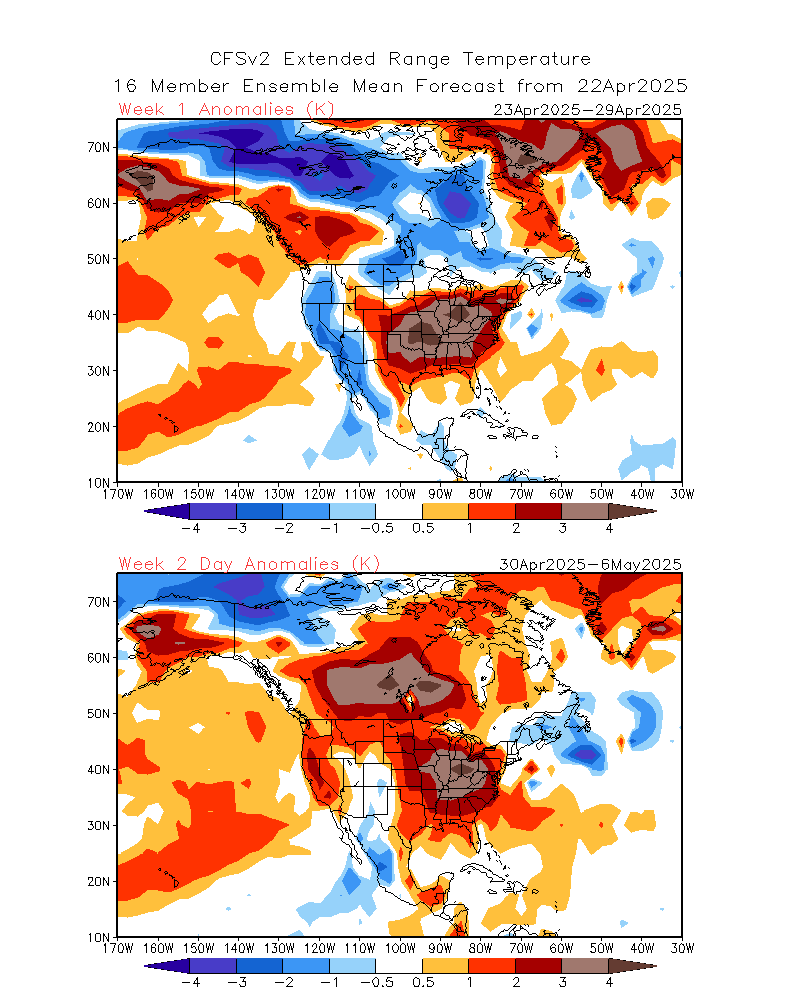
For the next two weeks the anomaly maps pretty much speak for themselves, not a lot of interpretive ability needed:
February natural gas futures: 1.901 down 0.025
Soon to be front month March contract: 1.873 down 0.031
I will point out that for the next two weeks things are looking up for polar ice in both our areas of concern, the Bering Sea/Straits/Chukchi Sea and the Fram Strait east of Greenland.
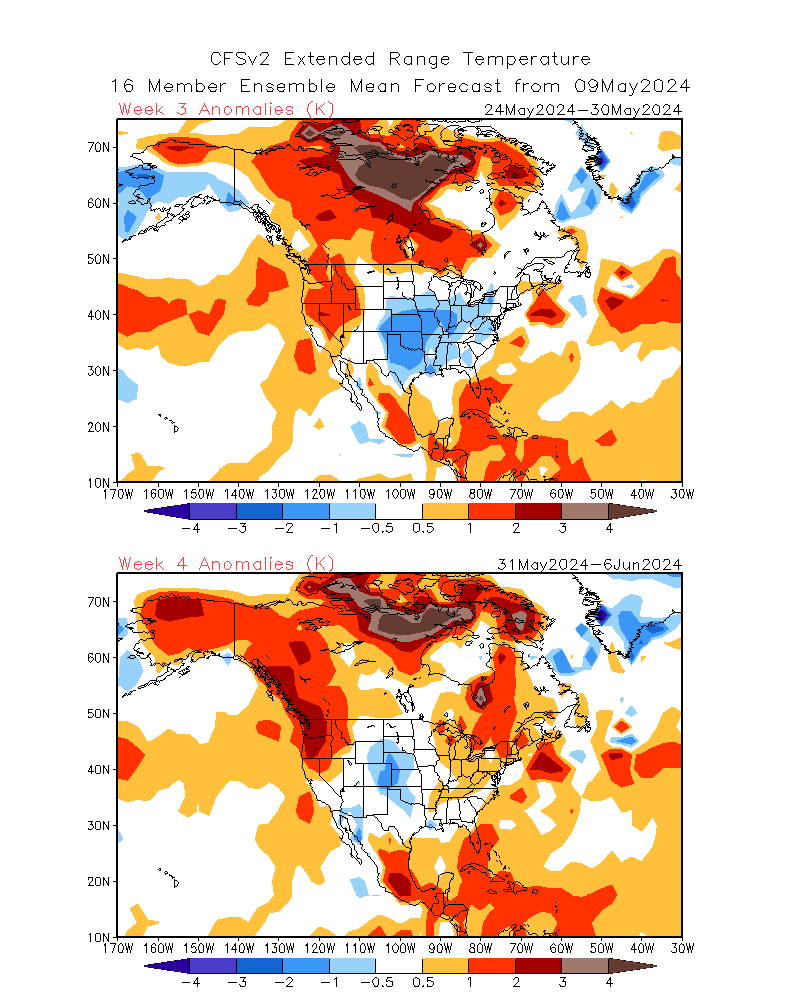
Here are weeks 3 and 4.