But you knew that.
From Phoenix Capital Research via ZeroHedge, September 20:
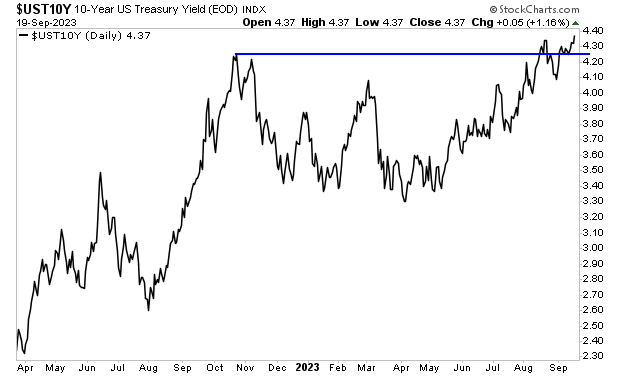
The most important bond in the world has just broken to a new low.
Our financial system is backed by debt, specifically, U.S. Government debt or Treasuries. These bonds are the senior-most assets in the world, representing the bedrock of our banking system and financial markets. The yield on these bonds represents the risk-free rate of return against which all risk assets (stocks, real estate, oil, etc.).
Now, when we talk about Treasuries, we are actually talking about a series of bonds of different duration ranging from 4-weeks to 30 years. The total list is below.
Treasury Bill Maturation Periods:
- 4 Weeks
- 13 Weeks
- 26 Weeks
- 52 Weeks
Treasury Note Maturation Periods
- 2 Years
- 3 Years
- 5 Years
- 7 Years
- 10 Years
Treasury Bond Maturation Periods
- 20 Years
- 30 Years
Of these bonds, the 10-Year U.S. Treasury is the single most important one. The reason for this is that 10 years usually encompasses an entire economic cycle. This is the bond used to determine mortgage rates as well as pricing all longer duration assets (tech stocks).
I mention all of this because the yield on the 10-Year U.S. Treasury has just broken to new highs.
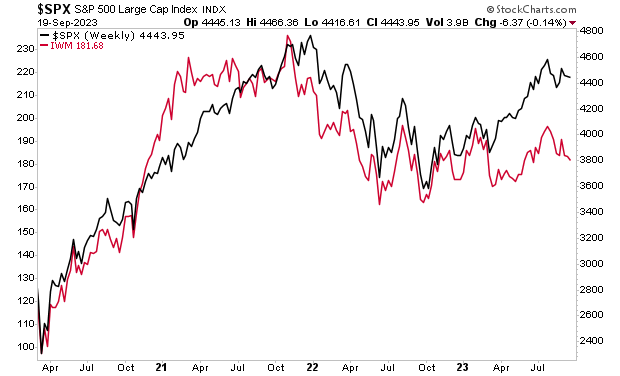
This is a HUGE deal. The risk free rate of return is rising… which means ALL risk assets will be repriced to lower levels in the near future. Small cap stocks, which are closely aligned with the real economy have already figured this out. The S&P 500 will soon follow.
That’s not the worst of it either. As I wrote in yesterday’s article, the Great Debt Crisis of our Lifetimes is fast approaching. I’ll explain precisely how the 10-Year U.S. Treasury fits into that in tomorrow’s article....
The 10-year just traded to yield 4.464% which is another 15 year high.
Here's a quick [self-reverential referential] victory lap, then back to work:
August 1, 2023
The Chart That Implied Longer-Term Interest Rates Were Going Higher
On May 18 we posted "One Of Our Favorite Chart Patterns",
noting the repeated touches of the 114 area by 10-year bond futures
that seemed to offer support over the period March - mid-May. The thing
to know about supports that are repeatedly hit is that each visit to the
level absorbs more and then more buying power, until eventually the
buyers quit buying and the support fails at that price.

Because the chart we used was a dynamic three-month pic I have to replace it with a piece of the one-year chart that includes the bit we highlighted but which also shows the evolution of the price of the futures on the 10-year following that post.
We happened to get lucky posting on the 18th because that day the bond futures had settled at 113.86 and it was off to the races.
The futures are down 0.45 today giving us a yield of 4.0350% up 0.0760% and seemingly on their was to retest the October 20, 2022 high yield of 4.3330%.
The ensuing decline in yields and the ructions in Japan in October 2022 marked the beginning of the current bull run in the major U.S. equity indices.
There It Is: The Yield On The 10-Year Treasury Index Futures Just Surpassed the October 2022 High Of 4.3330% (TNX)
4.3340% +0.0830% as of 10:13AM EDT
But it's that chart pattern that is so weird. It's the same pattern we saw before Beyond Meat collapsed, we have dozens of posts on BYND one but this one stands out*:
November 23, 2021Chartology: Remember The Chart Pattern That Preceded The Drop In Beyond Meat? (IWM; BYND)