Following on yesterday's "JPMorgan's Dimon warns world may not be ready for Fed at 7%, report says" we have Kimble Charting Solutions at SeeItMarket, September 25:
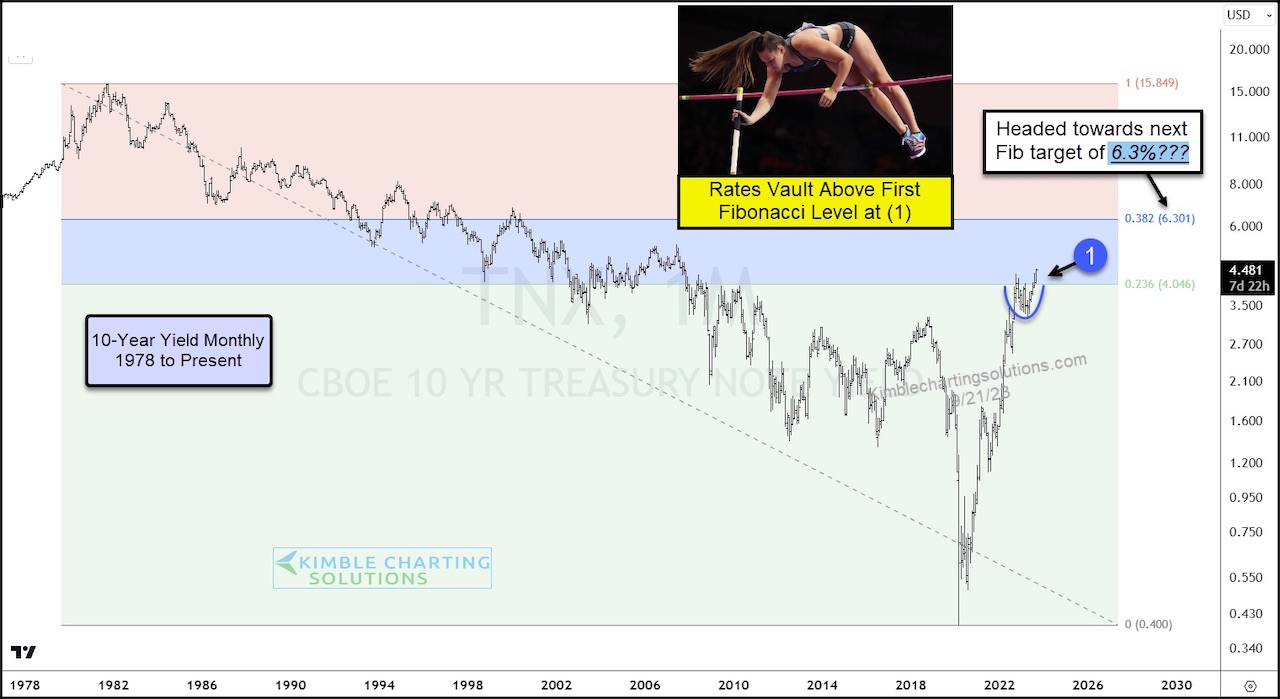
....Today’s chart looks at a long-term “monthly” view of the 10-Year Treasury Bond Yield.
And as you can see, it is looking more and more every day that yields have cleared the first fibonacci level at (1), based upon all-time highs and lows in yields.
This breakout means that the next Fibonacci retracement comes into play at 6.3% – the 38.2 Fibonacci level....
....MORE
Treasury futures are currently pricing a 4.6100% yield which is a sixteen year high.
Mr. Kimble sometimes uses these long timeframe charts which is something we take issue with. The underlying rationale for technical analysis is that it is a graphical representation of what people actually did in the market.
Which leads to "market memory", traders and investors did X at point Y as seen in volume and price. For charts that go back more than a few years there is no market memory, especially so for charts that begin forty-five years ago.
There is no magic in lines on charts.
That said, Mr. Kimble's been doing this for quite a while and we've seen him make some eerily accurate calls, so here you go.
As for Fibonaccis, you have to be careful. Human beings are so good at pattern recognition that we sometimes do pattern creation of things that aren't actually there.
On the other hand, I'm sure that the first thing our readers notice in the picture below is the Fibo spiral formed by the water:
