A threefer. The introduction to 2012's "The S&P/Inflation Expectations Correlation (SPY)":
A major caveat for investors trying to hedge inflation with equities: they aren't that correlated once inflation goes above 4% or so. 0-to-4% is the sweet spot. Above 4% you don't want services companies, manufacturers with tangible assets are the place to be.
This is one reason the Berlin market was able to approximate (with a 3-6 month lag) the Weimar hyper-inflation (the other being survivorship bias). The companies the historians track, the big brewers, metalworkers, miners had real assets.
Stocks of service companies without near-monopoly pricing power got crushed like any other long dated asset.
This is a point you won't see anywhere else, at least until the information contained in those dusty old German-language records gets translated....
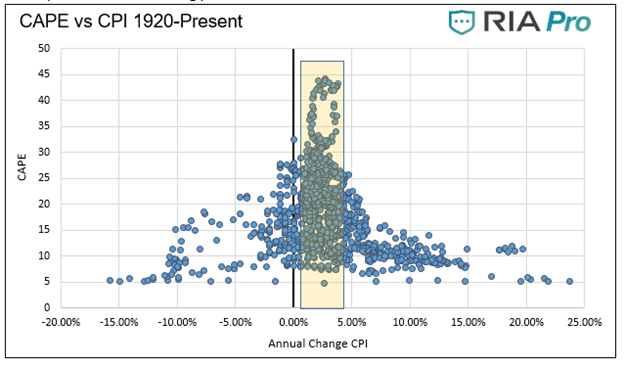
And, one of my all-time favorite scatter-plots:
From "Crestmont Research on Inflation, P/E's and Market Returns":
Here's another way to look at the relationship between inflation and P/E's. Note that both the highest inflation and deflation rates correspond with the lowest multiples accorded the earnings:

...MORE
Finally, to reiterate:
A subject near and dear. The sweet spot for P/E ratios is 1.00- 2.00% annual CPI inflation. As you move away from that in either direction multiples drop off pretty fast, to the point that equities are not an optimal investment. You won't believe what the best investments for inflation in the 8-12% and greater than 100% ranges are. I'll write about them if we ever go Weimar....
Stocks are priced for perfection. Bonds trade at historically low yields despite 7% inflation. What could go wrong?
As fiscal and monetary support for the economy and markets wane, valuation extremes are in the crosshairs. While the setup for 2022 is not looking as friendly as 2021, we must realize the environment can change quickly.
For more on the macroeconomic drivers supporting this forecast, please read Part 1 of our 2022 Investment Outlook – Tailwinds Shift To Headwinds.
2022 Investment Outlook for Stocks
Valuations
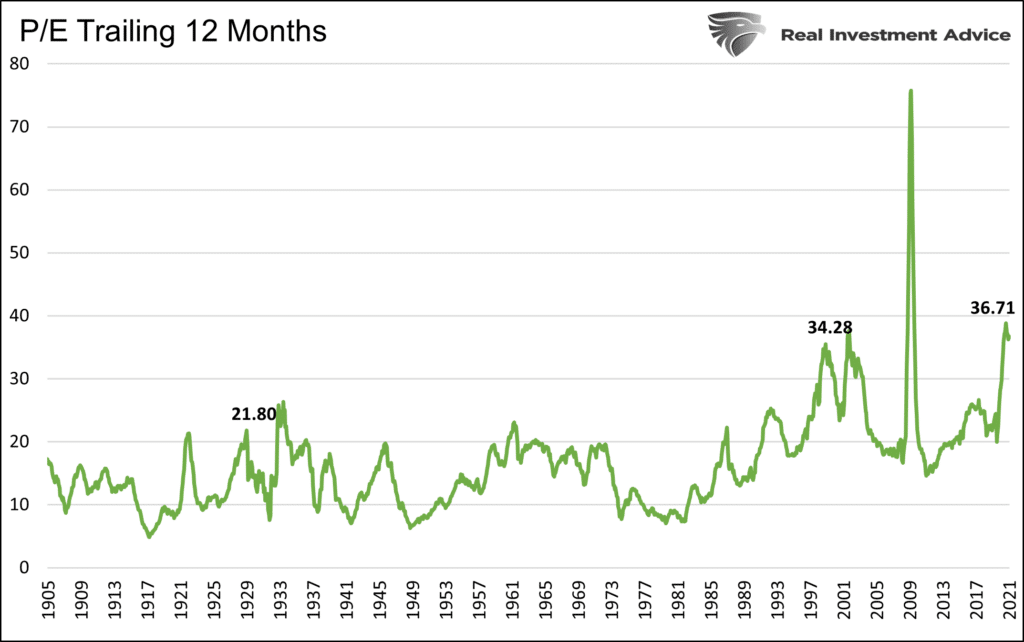
As shown below, as we have highlighted in many articles, valuations are at or near record levels. While nothing limits valuations from rising further, we must consider a reversion to the mean in many cases can result in losses of greater than 40%.
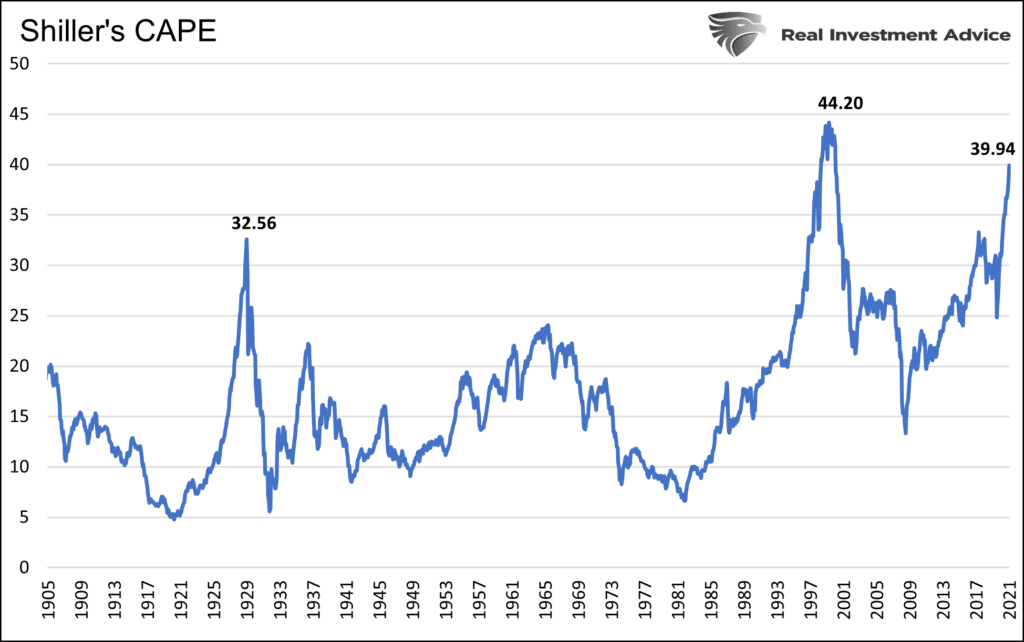
Complicating the valuation story is inflation. The graph below shows that historically periods of low inflation or deflation or inflation running greater than 5% are accompanied by CAPE readings of 25 or less. The current reading is 40.
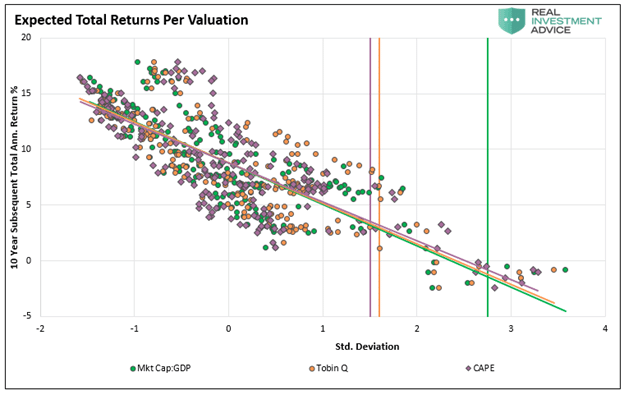
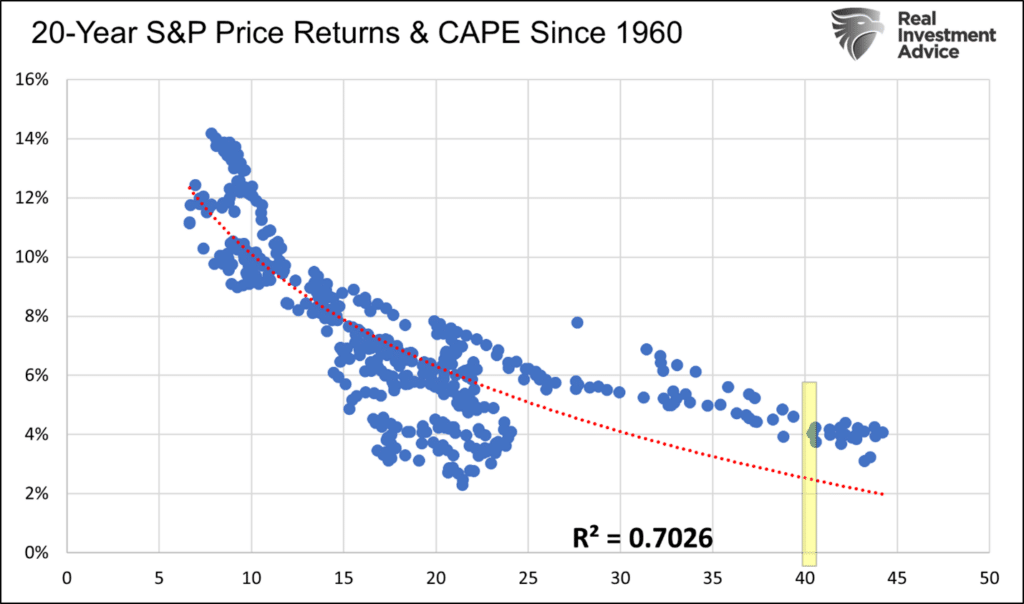
The graph below uses three popular valuation techniques to quantify longer-term future returns. Based on the data, the ten-year outlook is for low single-digit returns at best. The second graph uses CAPE in a similar fashion to show the 20-year outlook is not much better. While our analysis may seem bearish, we reiterate that nothing says valuations cannot continue to stretch further.
Profit Margins
Corporate profit margins rose to record levels in 2021. Many companies were able to push higher costs onto consumers. At the same time, they were the ultimate beneficiaries of excessive government spending....
....MUCH MORE