While we, on the other hand, were soliciting indications of interest for Kringle Group, LLC right up to the early close that day.*
Now these folks are hopping on the sleigh.
First up, the usually ursine Slope of Hope, April 13:
To expound upon my “bullet entering the brain” post from last night, let’s just go whole hog. Let us assume:
Having embraced those chilling assumptions, here are the measured moves for the cash indexes shown, represented in both point and percentage terms. These measured moves are based on the inverted head and shoulders pattern, all of which are complete except for the Russell 2000. Please note that the percentage gains are measured from the neckline, not from present price levels.
- The federal government has now perfected utter control of equities;
- They have absolutely no reason to ever let them decrease;
- It will be months, years, or decades, before they lose control.

pattern just completed last week

tinted area shows gains since pattern completion
...MORE
From StockCharts, April 12:
An Aggressive Projection for the Dow
Have you ever played devil’s advocate in a group discussion? That's the situation where everyone comes to one conclusion, so you take the opposite side just to provide an alternative hypothesis and argue its merits.
We often avoid this sort of “outside the box” thinking because of confirmation bias. Once we’ve decided we’re bearish, we assign greater importance to any new bearish evidence because it supports our predetermined thesis.
One way to combat this is to play devil’s advocate with your own process. Once you’ve drawn a conclusion, force yourself to take the opposite side of the argument. What would need to happen to make your thesis completely incorrect?
To be clear, I’m overall bearish on US equities here. I’m not “the world is ending” bearish, but I’m more in the “I just can’t see much further upside from here” camp. I wouldn’t be surprised if we end the year within 5% of where we’re at right now.
But what if stocks go dramatically higher from here? What would have to happen for my flat-to-down thesis to be incorrect?
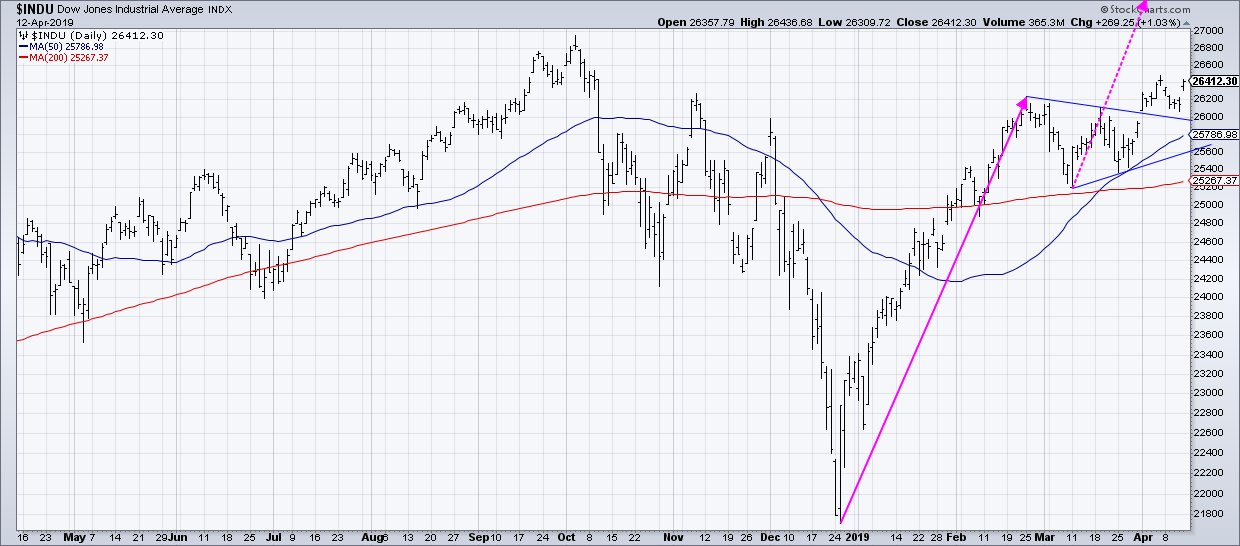
This idea came to me when I looked at a daily chart of the Dow after the close on Friday, shown below:
 I
I Also at StockCharts:I decided that the month of March looks like a pretty classic pennant pattern: a long uptrend followed by a short-term consolidation with lower highs and higher lows.If that was a pennant, which resolved to the upside the first week in April, then what would the upside target be for the Dow? Based on the length of the flagpole, that would mean an upside objective of 30,466, about 15% higher than current levels. Take a similar measurement on the S&P 500 (which did not have a pennant, but you figure if the Dow goes up that much, then it's fair to say the S&P could go up a similar amount) and that gives you a target of 3265....MORE
Here Are The Industry Groups Flying Into Earnings Season
Finally, Top Down Charts, April 8:
Sentiment Snapshot: Melt-Up Time?
* Dec. 26
Equities: Thank You Santa
I received the options on the S&P futures and I have to say, earlier this morning I thought XXL was far too big
And on top of that I was a bit nervous about having gone public with December 20's Hulbert: "Santa Claus is coming to Wall Street — after Christmas", reiterated as the first sentence in Dec. 23's Equities: "Nothing Goes to Hell in a Straight Line, Not Even Stocks".
If you hadn't come through all those young people on the internet might have lost faith and stopped believing,
But you delivered Santa, you did!
Right down to the minute!....