You have only to ask.
From Wolf Street, Dec. 22:
But a whole generation of investors has never been through a Nasdaq-bubble unwind, and they’re shocked.
I just dug out my “Dow 20,000” hat, but I might not need it for a while because nothing goes to hell in a straight line. And I still have my “Dow 10,000” hat somewhere just in case, though I doubt I’ll need to go look for it anytime soon for the reasons I’ll explain in a moment.
I have to admit, this was a beauty of a Santa rally. We were promised a Santa rally by the buy-buy-buy hype organs on Wall Street, so here we go with our Santa rally:
The Dow dropped 6.9% this week, to 22,445, and is down 9.2% for the year. It’s down 16.3% from its all-time peak in September. It’s only about 11% away from my “Dow 20,000” hat. The last time we saw 20,000 on the way up was in January 2017. But rolling back 21 months of gains in the stock market — from September 2018 back to January 2017 — is nothing. The big deal is how much the Dow has surged over those 21 months from 20,000 to the peak in September: 35%.
Over the same period, the economy grew maybe 5%. So going back to 20,000 will just surgically remove the very tippy top off the bubble.
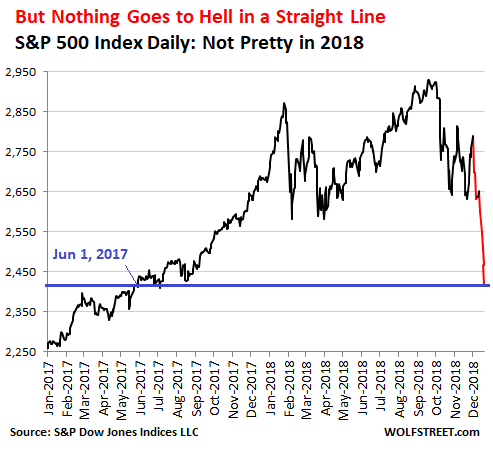
The S&P 500 Index dropped 7.1% this week and is down 9.6% year to date, down 17.5% from the peak in September, and back where it had first been on June 1, 2017.
The chart is not exactly pretty, with that nearly straight red line south, but let me assure you again: Nothing goes to hell in a straight line, and in a moment, I’ll get to why this one won’t either.
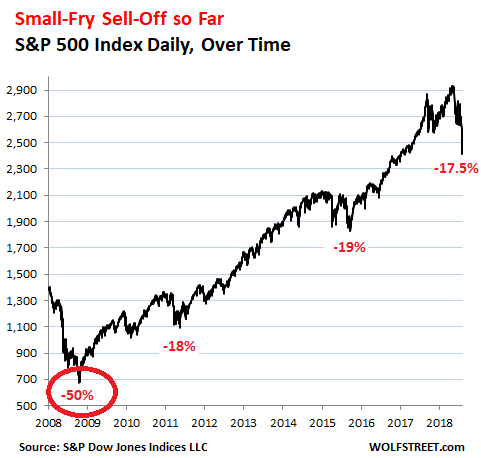
The long-term chart puts this into perspective: The nine-year surge has been so huge that the current sell-off doesn’t really measure up, especially not compared to the last major sell-off during which the S&P 500 dropped by about 50%:
The Nasdaq dropped 8.4% this week to 6,573, and is down 8.3% year to date. “Nasdaq 5000” not yet. But those who promised us Nasdaq 10,000 will have to be patient, very patient. The Nasdaq is down 22% from its peak at the end of August, and is back where it had last been in September 2017.
But when the Nasdaq, which is powered by the FANGMAN stocks — Facebook, Amazon, Netflix, Google, Microsoft, Apple, and Nvidia — heads south, it’s good to remember the stocks on this index are huge bubble-blowers, and they can plunge hugely. In the 2000-2002 sell-off, the Nasdaq plunged 78%. So a 22% decline in the Nasdaq is fairly minor.
But there is a whole generation of investors out there who have never been through a Nasdaq-bubble unwind. For them, this is the first real tech stock sell-off, and they’re shocked. For them, tech stocks can only inflate. They can never deflate. They don’t know from experience that hundreds of the companies on the Nasdaq will fold during such a sell-off because they run out of money to burn and just disappear. A real Nasdaq sell-off entails a real shake-out, where the wheat is separated from the chaff, and this chaff in your portfolio goes to zero.
So how bad can a Nasdaq bear market get? Well, from experience, it can get a lot worse than expected. That’s what Nasdaq sell-offs have taught us.
In terms of magnitude, the FANGMAN stocks have provided much of the fuel for the Nasdaq bubble. So let’s step back and reflect on what Goldman Sachs said about these tech stock in June 2018. I covered this propitious event with an article titled, “FANGMAN Stocks Are Not a Bubble, Pleads Goldman Sachs. This time, it’s different, said the strategists.” I wrote: “With regards to tech stocks, no matter how high they’ve soared, there is no bubble, based, believe it or not, on fundamentals, Goldman Sachs strategist Peter Oppenheimer and Guillaume Jaisson pleaded in a note. And the fun is going to continue, they said. And it’s different this time.” And then I debunked them with some numbers, such PE ratios and price-to-sales ratios.
The FANGMAN stocks combined reached a market capitalization of $4.63 trillion on August 31 that has since plunged 27%, or by $1.26 trillion – just these seven stocks, all of them traded on the Nasdaq! By the sheer size of their gargantuan market capitalization, they were the powerhouse on the way up, and they’re the powerhouse on the way down. Their combined market cap is now back where it had first been on October 25, 2017:....MUCH MORE