From StockCharts:
The Financials Sentiment Indicators Suggest This Might Need More Time
It looks like another tough month for the markets as year-end approaches. The index swings are getting increasingly aggressive and it feels like nearly every sector is getting yanked around. While there are lots of reasons to be bullish based on some of the "oversold" sentiment indicators, other reasons suggest a more worrisome stance.
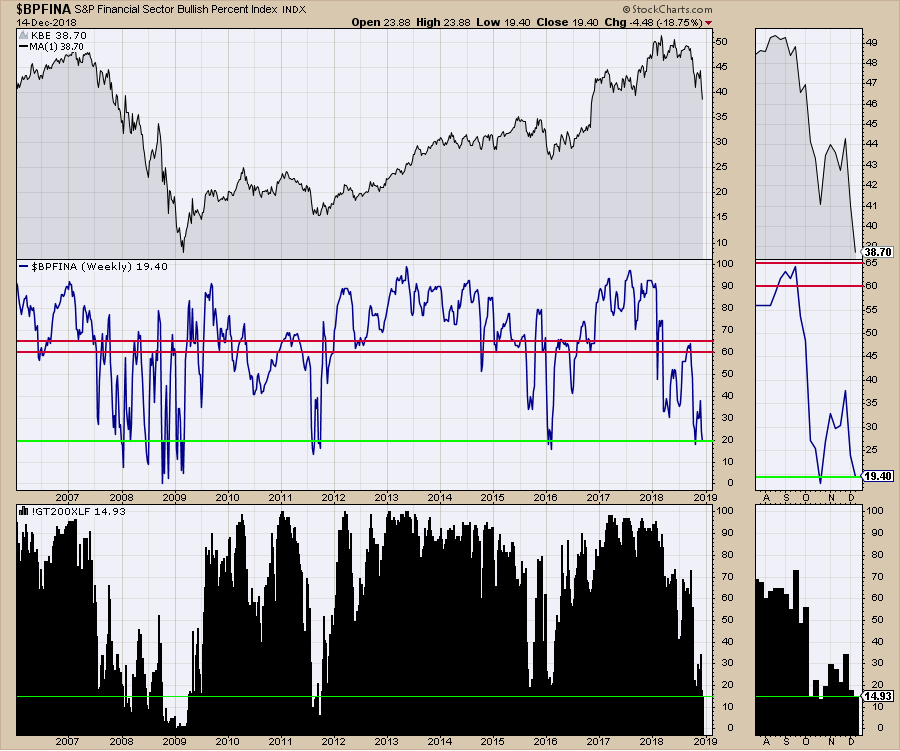
In the chart below, the top panel shows the KBE Bank ETF, which has sold off by 25%. The dip isn't quite as big (in percentage terms) as the big dips of 2011 (42%) and 2016 (28%) were.
Looking at the Financials Bullish Percent Index in the center panel, we can see that we are down near some of the big retracement levels. 2008 and 2016 reached these low levels close to the start of the new year.
The percentage of stocks above the 200-day moving average is shown in black on the bottom panel. When the market gets this weak, it typically needs more time to correct.

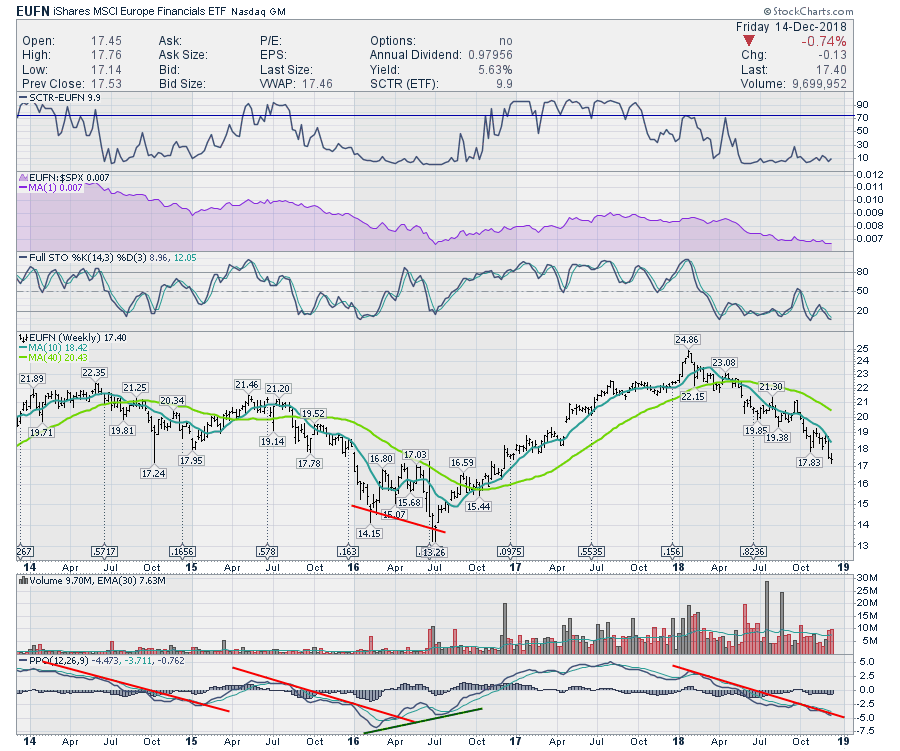
Currently, one of the big problems is that the global banking charts look terrible. As one of the New York-based technicians said, when the banking charts go bearish, that is when there are problems. The reason is that the bankers can see everyone else's books. The chart below shows the European Financials ETF. Even though there is no divergence on the chart yet, the ETF is off 30% from its highs.

The US Bank charts have plummeted in the last 9 trading days. The KBE Bank ETF has sold off 13% in two weeks and is 24% off the high. Ouch!...MORE
Recently:
Equities: "Banks Are Bleeding Profusely " (BKX; XLF)
"Goldman Sachs Trading Below Tangible Book Value" (GS)