From Property/Casualty 360°:
At the start of the 1992 hurricane season, catastrophe-modeling company AIR had been in business for five years, and its hurricane model was projecting that a major hurricane striking Miami could cost the insurance industry more than $30 billion.
This seemed like an outlandish figure at the time — few people believed this number or even knew what a catastrophe model was.
It was difficult to convince insurers and reinsurers that a new approach to estimating catastrophe losses was needed. The reinsurers were quite sure their tried-and-true traditional formulas were robust and they needed no other tools. After all, they had been making money for decades. Insurers simply relied on the brokers to determine how much reinsurance they needed, and that, too, seemed to be working fine.
The traditional approaches seemed adequate because no major hurricane had made landfall near a highly populated area in decades. And while the 1970s and 1980s were relatively inactive with respect to hurricanes, property values along the coast were growing exponentially. But insurance companies were not monitoring their exposures in 1992 — insurers and reinsurers were using premiums to estimate potential catastrophe losses.
Hurricane Hugo, instead of serving as a strong warning, had made companies even more complacent. The insured loss from the 1989 storm was only $4 billion, even though the hurricane was a Category 4 storm that “hit” Charleston, S.C. Actually, Hugo’s most intense winds occurred well to the north of Charleston along a sparsely populated area near McClellanville, S.C. So even after Hugo, the industry thought the probable maximum loss for the market as a whole for a hurricane hitting anywhere along the coast was $7 billion.

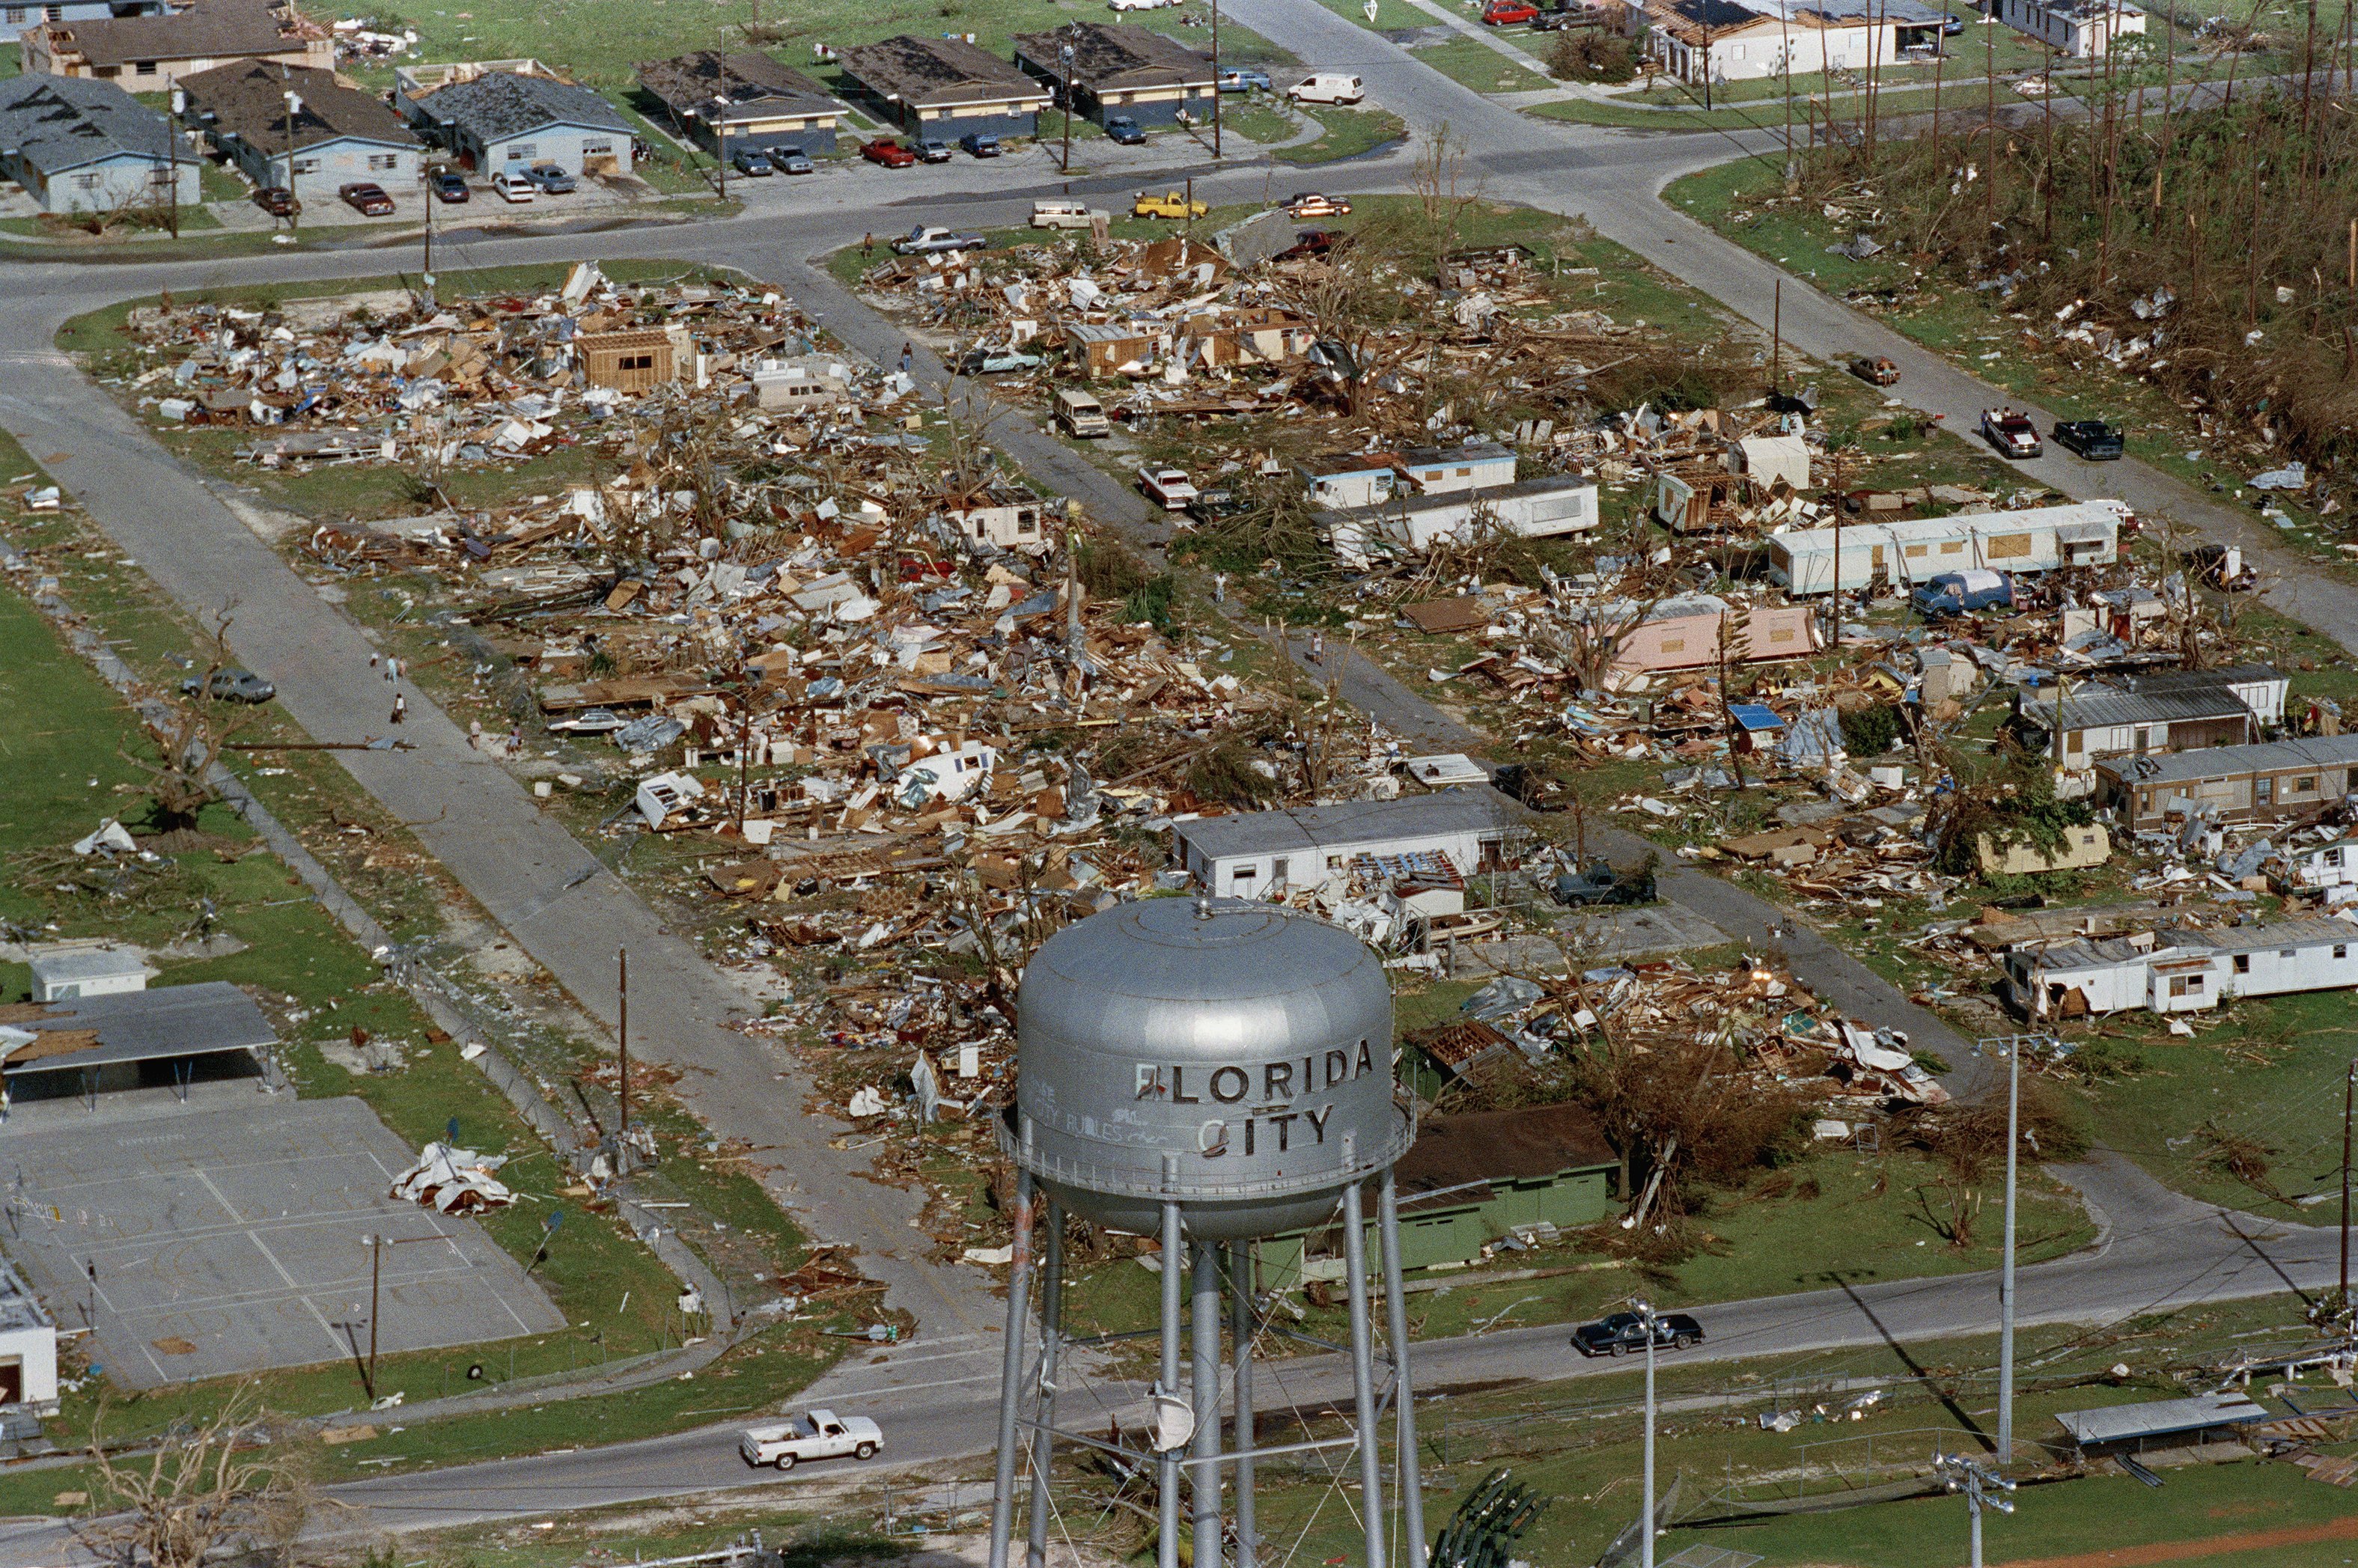
This water tower, shown Aug. 25, 1992, a landmark at Florida City, Fla., still stands over the ruins of the Florida coastal community that was hit by the force of Hurricane Andrew. The storm damage to the South Florida area was estimated at $15 billion, leaving about 50,000 homeless. (Photo: Ray Fairall/AP Photo)
Enter Hurricane Andrew
As Hurricane Andrew was making landfall on Aug. 24, 1992, there was again disbelief when the first hurricane model projected that the loss could exceed $13 billion.
In fact, it would take more than six months for the industry to fully realize it was going to pay out $15 billion in losses. And it didn’t take much math to calculate that had Andrew hit farther north, closer to downtown Miami, the loss could have been $60 billion.
Fast forward to 2016 and complacency has once again set in.
It’s been 10 years since a hurricane has made landfall in Florida — unprecedented in the historical record — and no major hurricane has made landfall near a populated area in the United States since 2005’s Katrina. Coastal property values in Florida and elsewhere have continued to swell. The catastrophe models have now become the traditional tools, and the industry has become far too comfortable relying on the model-generated probable maximum losses.
Over the past few years, new tools have come into the market, and these innovative scientific techniques clearly show that the traditional catastrophe models don’t provide a full picture of an insurer’s loss potential. In many cases, the traditional model-generated probable maximum losses give a false sense of security — just like the traditional approaches used in 1992.
And as in the pre-Andrew days, there’s inertia, and even some resistance, to new scientific methodologies and insights into catastrophe loss potential.
Using the characteristic event methodology
Among the new tools is the characteristic event methodology that provides insurers with information on what size losses different return period events will cause.
CEOs, boards and other senior decision makers in the insurance industry often mistakenly refer to their 1-in-100-year probable maximum lossess as the 100-year events. But the model-generated probable maximum losses don’t refer to any specific events — they’re simply points on the estimated loss distributions. And what is also often forgotten is the 100-year probable maxim loss shows the loss amount for which there’s a 1% chance of exceedance....MORE