Dec. futures $4.68 up 4. Soybeans are where the upside action really was and we are already seeing some deceleration in the rate of change (2nd deriv.) of the price. $12.35 up 9 3/4 cents.
From Dragonfly Capital:
Corn had a long bull run higher through out 2010 and 2011, more than doubling. It has bounced around a bit since then, making a higher high, but recently making a lower low, and changing the long term trend. But with Corn ($ZC_F, $CORN) off more than 45% since the high, can it still go lower? Several signs suggest yes.
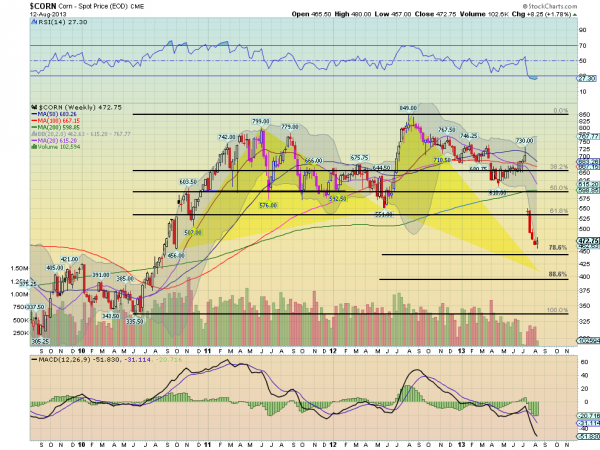
The chart above shows that there are at least 4 signs that point lower. The bullish Shark Harmonic pattern would not complete until 411, 15% lower. The next major Fibonacci retracement level at 78.6% does not come until 445 with the 88.6% level at 394 below that. The last cluster of previous price history is lower between 335 and 420. The MACD is continuing lower on the signal line. In fact the only sign that makes one optimistic for a bounce is that the RSI is technically oversold and starting to turn higher. With the weekly chart closing outside of the Bollinger bands for the last 4 weeks, a consolidation or bounce higher becomes more likely. But the other signals have you lean toward consolidation, working off the oversold with sideways action in price.I think the chart's colors are pretty.
Yesterday:
Crapski: "Bulls roar back on USDA crop cuts"
Corn: Deutsche Bank Takes a Farm Tour and Cuts Price Estimates