Our medium term mental map is a fake-out shake-out, i.e. higher to suck in some buying and then a 10-15% drop, back under $100.
There is a lot of oil sloshing around and Asia isn't going to be needing it for a while.
First up, Dragonfly Capital:
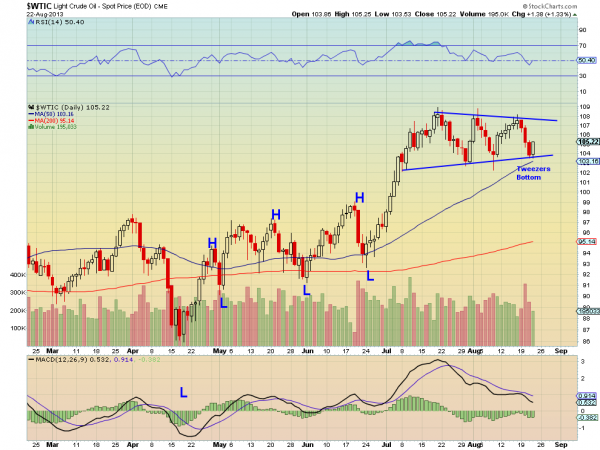
Crude Conviction in the Short Term Can Grow Stronger
Crude Oil moved higher in July breaking the range and 100 barrier that had stopped it for months. Now it is consolidating in a symmetrical triangle on a short term basis. In the very short term the Tweezers Bottom near the 50 day Simple Moving Average (SMA) bodes for a move to at least the top of the triangle at 107.50-108.00. What makes it s bit more interesting on this leg is that it nearly touched the 50 day SMA. The last time it was there was before the move higher from 94 to 106. A break of the triangle higher carries a target from the pattern break to 113.50 and then a Measured Move higher to 118.00.
Baby steps first to 107.50-108. Then a slow trot to 113.50 and full run to 118.
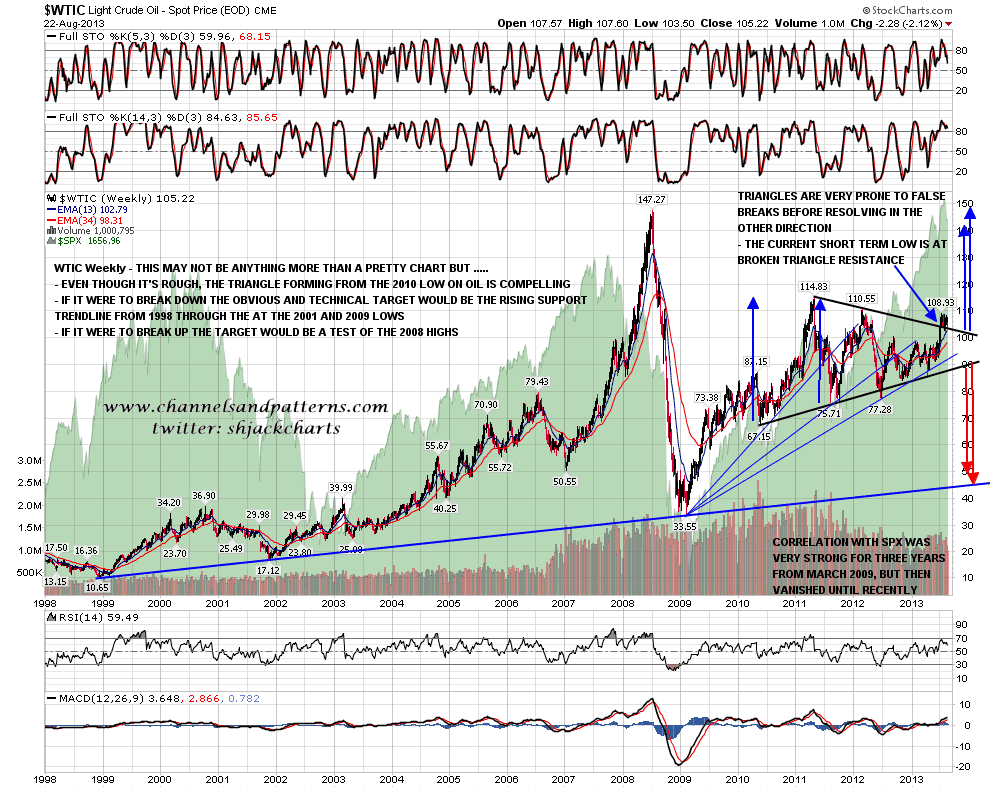
Slope of Hope also points to a triangle but this time on the weekly chart and with less conviction:
...This is a large triangle scenario predicting a very big move in either direction. WTIC has broken up from the triangle but these patterns are prone to false breaks. The current CL bounce was at broken triangle resistance and if CL breaks back into the triangle the next target at triangle support would be close to the 96 double-top target that I was looking at yesterday on the CL chart. If CL were to break that level the triangle target would be at long term support in the 45 area which would be interesting. WTIC weekly chart: