Every few months we like to take a closer look at two key metrics which help to better demonstrate recent trends in the catastrophe bond primary issuance market. These two metrics help to demonstrate where insurance-linked securities investors risk appetite lies when it comes to cat bond and how pricing has moved recently.
With the catastrophe bond market reaching a new all-time high of $18 billion of risk capital outstanding and 2013 issuance well on the way to setting records in terms of deal volume issued, it’s a good time to revisit the risk premium and expected loss of the outstanding cat bond market.
Once again we’re using data from the most recent Willis Capital Markets & Advisory quarterly ILS and cat bond market report. You can read more of our commentary on WCMA’s recent report in our article from the 24th July, entitled: ILS and cat bond market has questions to answer to maintain growth: WCMA.
Given the recent influx of new capital into the ILS market, the heightened interest in investing in catastrophe bonds and other catastrophe reinsurance-linked investments and the resulting impact on pricing which has been well documented, it’s safe to assume that the data will show some reasonably large movements in these metrics in recent months.
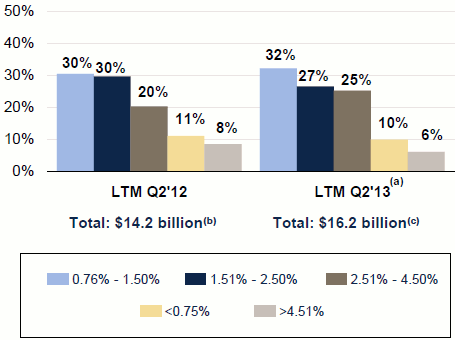
Distribution of expected loss within the catastrophe bond market First we’ll look at the expected loss distribution within the outstanding catastrophe bond market, as measured by WCMA. The expected loss distribution of the cat bond market can show us, on the issuers or sponsors side, the level of risk that cedents feel the cat bond market is receptive to, while secondly, on the investor side it gives us an insight into investors risk appetites.
This gives a view of the severity of risk sponsors want to offload to the capital markets, versus risk retained or reinsured in the traditional reinsurance markets. It also helps us understand the appetite for risk, motivations behind capital deployment and the level of return that ILS investors are willing to accept for assuming a certain level of risk. Comparing the expected loss to the risk premium makes this even more telling as you can clearly see where investor risk appetite lies across the broader ILS and cat bond market.See also:
So, below you can see the distribution of expected losses within the outstanding catastrophe bond market at the 30th June 2013. It’s worth noting that WCMA’s market figures exclude a number of deals that other reports put as issued in Q2, but the trends remain the same. You can see from the graph that the market is $2 billion larger in 2013 than it was a year earlier and it looks like issuance has been focused on two expected loss brackets which have increased the most, the lower risk bracket of 0.76% to 1.5% expected loss and the mid-risk bracket of 2.51% to 4.5% expected loss.
Catastrophe bond par outstanding by expected loss - Source: WCMA
From the above it does look like there has been a slight reduction in risk appetite from investors over the past year, but actually given the increased size of the market and the reductions in return that investors have been receiving, it actually shows that expected losses have not changed all that much across the whole market. There continues to be a clustering of deals within the 0.76% to 4.5% expected loss range. It would be interesting to see this broken down even further, perhaps by percentage point to show any clustering around specific expected loss points....MORE
Insurance: Hannover Re Reports Earnings Up 29%, Makes Munich Re Look Incompetent
Insurance: Very Quiet Start to the Hurricane Season (ALL; CB; TRV)
Insurance: Property Casualty Looks to Be Extremely Profitable This Year (TRV; CB; ALL; AIG)
