Because it is a member of all the major indexes, and because in the case of market-cap-weighted indices $3 trillion is real money (I guess 3 trillion is real money anywhere except maybe Washington DC) the effect of price moves in Apple can be dramatic. As one example, in the Nasdaq 100 index (tradable in futures or the QQQ) Apple's weight is 10.99%. If interested here is Invesco's page on the ETF.
AAPL closed at $172.17 up $0.17 (0.10%) and is down 0.71 (-0.41%) to $171.46 in early pre-market trade.
And from ChartWatchers, January 7:
Apple (AAPL) Could Be On The Verge Of Tumbling, Putting The Entire Stock Market At Risk
We're about to find out.
I liken the current stock market environment to stepping into The Twilight Zone or the Great Unknown. This post-pandemic market has been brutal in terms of rotation. Most growth stocks have tumbled amid the inflation and interest rate uncertainty; unfortunately, the inflation news is going to get worse, starting with this Wednesday's December CPI report. There is good news on the horizon, but we're going to need to be patient and avoid the traps and pitfalls along the way.
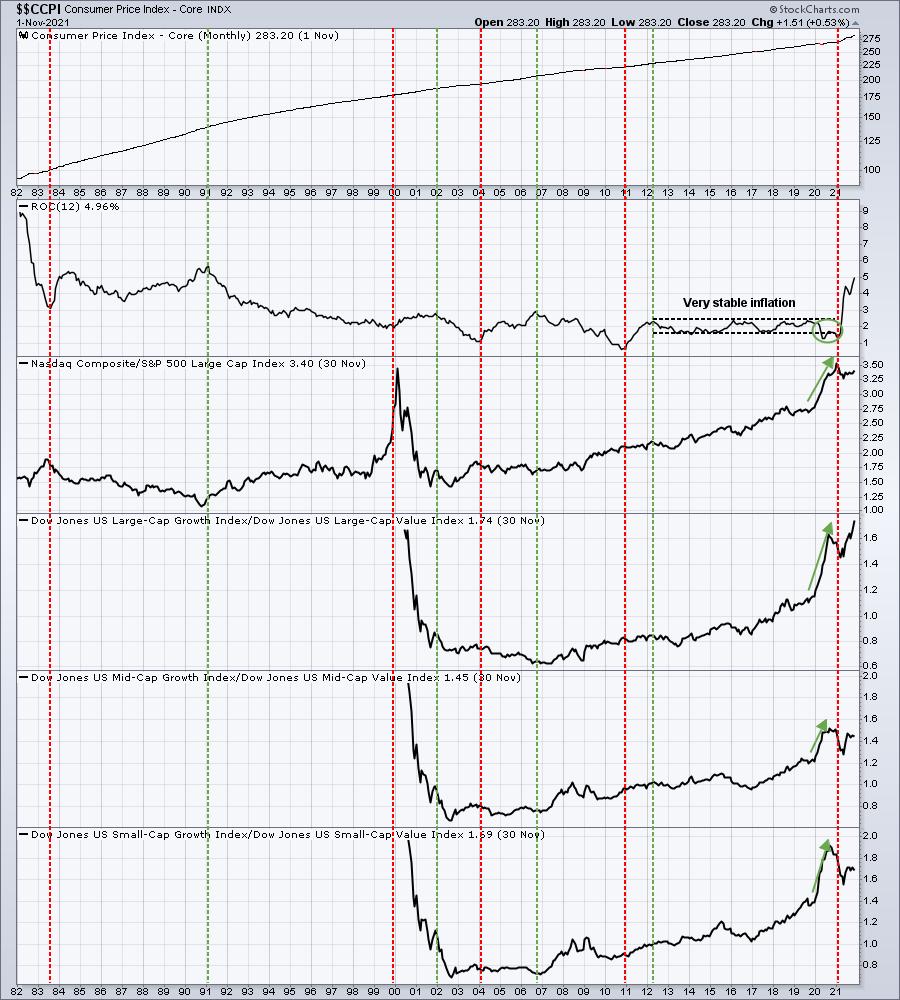
The biggest issue with both higher inflation and higher interest rates is that they eat into valuations of growth companies. There are safe(r) havens, but typically you want to avoid areas of the market where valuations are highly dependent on future earnings growth rates. Hopefully, the following chart will help to explain this visually:

The red-dotted vertical lines mark bottoms in the annual inflation rate, just prior to a significant rise. Think of these as "Stop Signs" or "Red Lights" for growth stocks. The green-dotted vertical lines mark tops in the annual inflation rate. Consider these "Go Signs" or "Green Lights" for growth stocks. Growth stocks tend to struggle significantly relative to value stocks during periods of rising inflation. I see the core inflation rate rising to 6-7% before topping. If I'm right, growth stocks could still have plenty of relative weakness ahead.
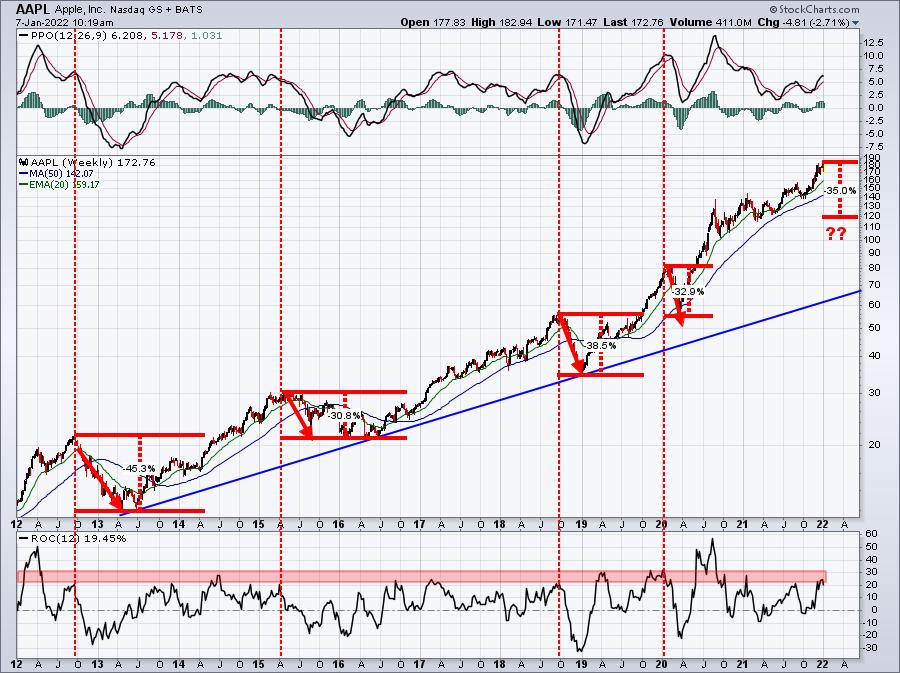
The overall market has held up well thus far. Why? Because the dozen or so large-cap stocks that comprise a big portion of the indices have held up very well. But if this market begins to roll over and key leaders like Apple (AAPL) lose support levels, it could get ugly very quickly. ETFs are flush with stocks like AAPL, MSFT, GOOGL, FB, TSLA, etc. Could AAPL fall 20%? 30%? I believe so. First, let's look at the NASDAQ 100 ($NDX) longer-term 10-year weekly chart:....
******
....MUCH MORE
The whole article is worth a look, here's his AAPL chart:
