Your fast changing Fed and the spur to runoff, charted
...We now expect the committee to raise the target range for the federal funds rate two more times this year, in June and September, and to announce balance sheet runoff at the December FOMC meeting....Basically telling us when the good times would end and the madness begin.
Fast forward to Wolf Street, December 6, 2018:
Fed’s QE Unwind Reaches $374 Billion
But how low might the Fed’s balance sheet go?
The Federal Reserve shed $54 billion in assets over the five weekly balance sheet periods that encompass the calendar month of November. This reduced the assets on its balance sheet to $4,086 billion, the lowest since January 15, 2014, according to the Fed’s balance sheet for the week ended December 5, released this afternoon. Since the beginning of the QE unwind — or “balance sheet normalization,” as the Fed calls it — in October 2017, the Fed has now shed $374 billion:
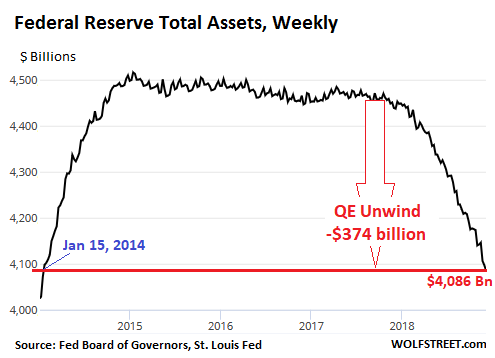
The Fed holds a variety of assets, including the Treasury securities and mortgage-backed securities (MBS) that it had acquired as part of QE. Between the end of QE in late 2014 and the beginning of the QE unwind in October 2017, the Fed replaced maturing securities with new securities to keep their levels roughly the same. Starting in October 2017, the Fed has been shedding Treasury securities and MBS.
How much lower will the balance sheet go?
The Fed held about $910 billion in assets in the summer of 2008, before the whole mess started. Over the prior decades, the amount of assets on its balance sheet had roughly grown in line with nominal GDP (not inflation adjusted); and this trend would have continued. In other words, there is zero chance the assets on the balance sheet will ever revert to $910 billion.
Since Q4 2008, nominal GDP has grown by 42%. Assuming that QE continues for five more years: At the average growth rate of the past few years, nominal GDP in 2023 will have grown by 72% since Q4 2008. If the Financial Crisis had never happened and if therefore the Fed had continued expanding its balance sheet in line with nominal GDP, the balance sheet would have reached about $1,570 billion by 2023.
This marks the absolute lowest point for the assets on the Fed’s balance sheet by the time the QE unwind is finished – but more likely, the balance sheet won’t drop quite that far.
Treasury Securities
Until October, the QE unwind had been in ramp-up mode. In October, it reached cruising speed, according to the Fed’s plan. In the cruising-speed phase, the Fed is scheduled to shed “up to” $30 billion in Treasuries and “up to” $20 billion in MBS a month, for a total of “up to” $50 billion a month. So how did it go in November?
From November 1 through December 5, the Fed’s holdings of Treasury Securities fell by $30 billion to $2,241 billion, the lowest since January 22, 2014. Since the beginning of the QE-Unwind, the Fed has shed $225 billion in Treasuries:
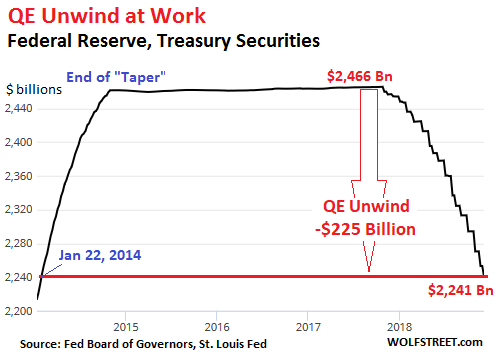
The Fed sheds Treasury securities by allowing them to “roll off” when they mature. When Treasury securities mature, the Treasury Department sends money to all holders of those maturing bonds to redeem them at face value. Treasuries mature mid-month or at the end of the month. Hence the step-pattern of the QE unwind in the chart above.As it turned out the Board directed the New York Fed's Open Market Desk to begin the roll-off operations in October 2017 rather than December but because we had marked our calendars and we dramatically scaled back our equity rah-rah which allowed a semi-sanguine view of, first the February, and then October-December volatility.
On November 15, three issues matured totaling $34 billion. On November 30, three more issues matured totaling $25 billion. So for the month in total, $59 billion in Treasury securities matured. This was an unusually large amount, the most since the QE unwind began.
Sticking to the plan, the Fed did two things:...MORE
We're still looking for equities to set their ultimate highs for this go-round somewhere above 3000 on the S&P but fully aware this transition by the Fed is a definite headwind and uncharted territory for pundits and participants and pundit-participants.
Here's the Fed go-ahead:
Implementation Note issued September 20, 2017
Keep your head down Mr. Keohane.
And readers, we meant every word of last Sunday's pair of posts after the G20 news but before Monday's big gap open:
Sunday, Dec. 2
Yuan Surges In Early Trading, Signals 2800 Open For The S&P
We cautiously caution, be cautious.
The real action in equities, and probable all time highs for the indices will come in the first quarter of 2019....
Sunday, Dec. 2
Trade Talks: Grains and Beans
More chance of an extended move here, over the next few weeks, here than in equities, see after the jump....