Velocity is a ratio of nominal GDP to a measure of the money supply. It can be thought of as the rate of turnover in the money supply--that is, the number of times one dollar is used to purchase final goods and services included in GDP.Velocity of M2 Money Stock (M2V)
2012:Q4:
1.535
Ratio
Last 5 Observations
Quarterly, Seasonally Adjusted, Updated: 2013-01-30 8:01 AM CST
I used the M2 chart because it is so dramatic but the story is true using any of the measures of money. Here's the chart for MZM, the most liquid money. It is also at an all-time low.
And from FT Alphaville:
It’s not a collateral shortage, it’s a scarcity of collateral
Further dispatches from the Danish Institute for International Studies’ conference in Copenhagen on “Central Banking at a crossroads”.
Today we focus on the new age of collateral-based finance and the presentation given by Manmohan Singh (speaking in an independent capacity rather than as a representative of the IMF).
The key takeaway from Singh’s presentation: it’s not a shortage of safe assets plaguing the system, but a scarcity of assets that’s the problem.
And there is a big if subtle difference between the two.
In Singh’s mind, collateral is money-like. It has its own velocity as well as its own multiplier effect.
The issue, consequently, is not a shortage of assets per se, but rather the declining reuse rate of assets that already exist.
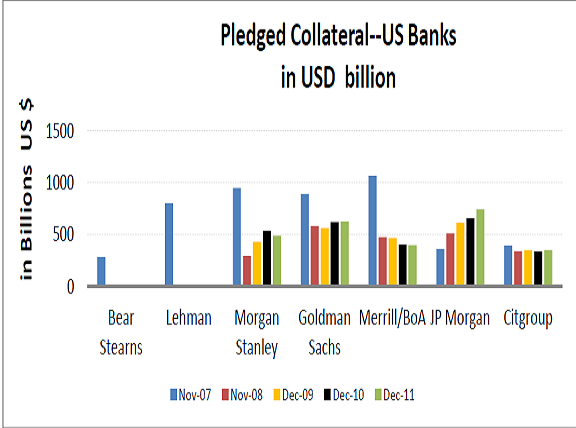
Referring to one of the best collateral charts FT Alphaville has ever seen on the subject, Singh noted how the level of pledged collateral that banks can use in their own name generally contracted over time (with only a few exceptions):
And now compare it to the European picture (and yes, there’s an obvious outlier)...MUCH MOREGo for the charts, stay for the comments.

