From Dr. Housing Bubble:
Looking into the crystal ball of California real and the 2011 market – 5 charts examining the future of California housing and real estate. Case Shiller Los Angeles tiered home price index, nonfarm employment, unemployment benefits, and total market inventory
The joy of the holidays provides a respite from all the economic challenges facing the California economy. It has been an arduous three years of riding on a financial rollercoaster and very few states depended on housing as much as California. There are varying metrics measuring the home price decline in California but overall the state has seen prices fall by 40 to 50 percent from the mountainous peak depending on what index you are looking at. A 40 to 50 percent decline screams like a Greek siren at a post-Christmas sale but is it a deal? Many Californians have adjusted their rose colored glasses and we have a generation of new home buyers that know nothing else than bubble home prices. To many, extreme home prices seem to come with the California territory like 405 gridlock or warm winter days. Yet bubbles do burst and the real question most should be asking is how much lower will prices go? To answer that, I want to examine a variety of measures including personal income to home price growth but also where the economy currently stands as we enter 2011.
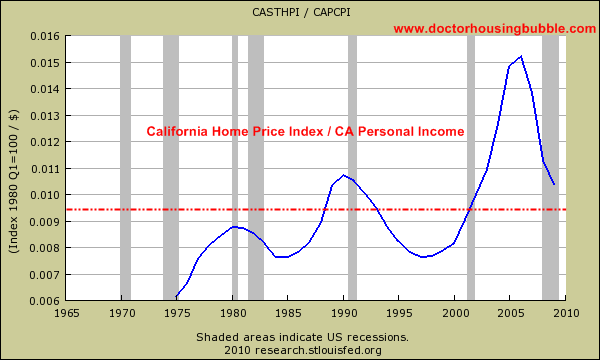
The first chart examines individual personal income and the California house price index. This index is provided by the Federal Housing Finance Agency. This index is generous since it puts the California home price decline from the peak at 31 percent. We’ll use this to measure it with personal income growth:
Chart 1 – CA House Price Index / CA Personal Income
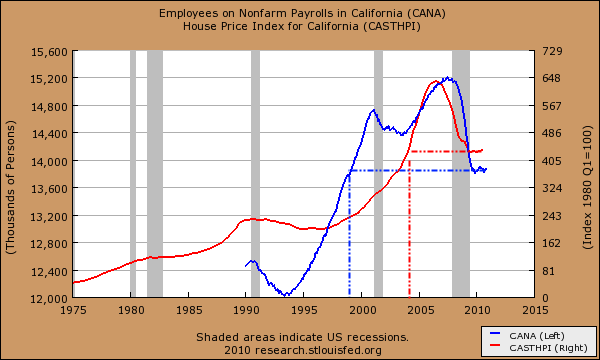
Even based on these generous assumptions, home prices on a statewide level are still inflated based on historical metrics going back to the early 1970s. What people need to keep in mind is that this metric averaged out during more prosperous economic times. What is odd is that with a statewide unemployment rate of 12.4 percent and an underemployment rate of 23 percent (second only to Nevada) you would expect that home prices would be below their historical average. This would make sense since housing should track the overall health of the California economy. What we see right now however is the housing market technically performing better if we use prices than the statewide employment market. Prices are coming down like tree sap from an exposed tree. We can measure this by using the CA House Price Index (CAHPI) and measure it up against total nonfarm employment:
Chart 2 – Nonfarm employees versus California Home Prices
Like a forensic investigator we need to find the turning points in markets and the chart above shows the story of two large employment bubbles. Through the 1990s it was technology based but in 2000 you see it move lower as the tech bubble burst only to rise up yet again as the California housing bubble took off. What is more fascinating about this chart is that home prices never corrected after the tech bubble burst and just kept going up like a silver helium filled balloon. So using the start of the housing bubble as the starting point may not account for the price correction that should have occurred after the technology bubble popped. What you find in the above chart is that employment kept expanding roughly 1 to 2 years more after the peak in home prices was reached in the latest real estate bubble. Nonfarm employment in the state is now back to late 1990s levels and California home prices are back to levels last seen in 2003. Inflation adjusted prices are now flirting with a lost decade similar to what Japan is experiencing with their two lost decades.
If you look closely above, nonfarm employment has hit a trough but hasn’t moved up. The same applies to housing prices. The question is where do things go from here? It would be absurd to assume that home prices would go up and lead employment growth. This was the cause of the last bubble. It is safer to assume that employment growth will then lead to future home price growth. Yet home prices are still inflated simply by examining historical price metrics. But you also have to parse the data. A mortgage broker that made $100,000 or more a year and now can only find a $30,000 a year job is now counted as fully employed. Yet it would take 3 brokers and some change for what was produced in income (and tax revenues) from the peak bubble years....MORE

