We've got 45,000 of the suckers in the link-vault so I can probably jury-rig a post without it,
First up, from Dividend Growth Investor, the length of bear markets:
Since 1956 however the average duration of bear markets has been about fourteen months. The average decline since 1929 has been 38.2% versus 31.8% since 1956.

It has taken S&P 500 about 5.2 years on average to recover from to above its bear market highs since 1929. If we check the same parameter starting in 1956 the average recovery time from a bear market comes out to 2.8 years on average.
If history could be of any guidance, S&P 500 could continues falling for five to nine more months by fourteen to twenty-two percent from current levels. This means that S&P 500 could fall to as low as 967 to 1068 until the end of 2008.
Next up, Daily Wealth gets into the timing issue:
...The 1990-91 recession was the last time we saw both real estate and stock prices take a hit at the same time. Officially, the recession was relatively short, only lasting about a half a year.
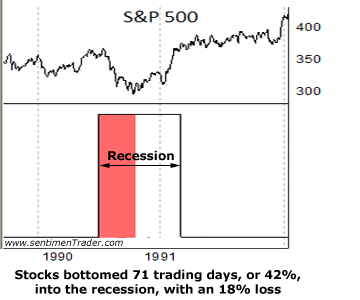
The chart tells the story of what happened to stocks:

As the chart shows, the stock market bottomed just about halfway into the recession... when things appeared darkest. The stock market then started to recover as things began to appear better.
In the 1990-1991 recession, stocks bottomed 71 trading days into the recession – or 42% into the recession – and had an 18% loss. The market's performance during the 1990-91 recession is fairly typical...
and from his friends at SentimenTrader a couple more of the charts:
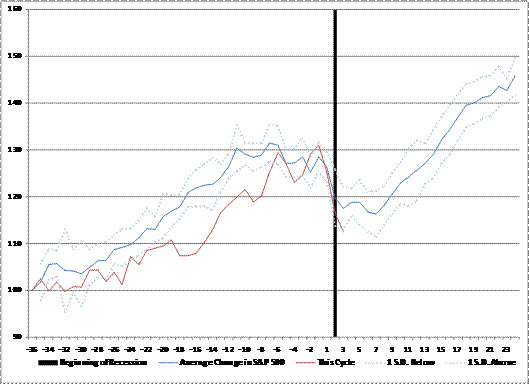
...On average, the recessions lasted roughly 220 trading days, or nearly a full year. The S&P was able to find a meaningful bottom after 129 trading days, or roughly six months after recession began, and at about the half-way marker of the recessions' durations. The S&P gave up an average of 19% of its value from the recessions' starts to the six-month lows, with a range of -6% to -42% (ouch).
None of them showed the S&P bottoming earlier than 52 trading days, or later than 282 days, giving us a very rough approximation for a window on when we could expect a low this time around. That's assuming we're in recession, and know when it began.
Taking a best guess, it's likely that we are in recession, and it began last quarter - suggesting we should see a major stock market low by sometime this summer. But given the variability in the duration range of past recessions, and the unique difficulties in identifying a recession ahead of time, we have to take that kind of forecast with a big grain of salt....


Finally John Hussman wades in with some general points on markets and the economy:
...Markets
If we assume the economy recently entered recession, the stock market has performed as would be expected. On average, the market peaks about six months prior to the start of a contraction and begins to decline more aggressively as the contraction begins. Based on the 9 previous recessions since 1953, the market bottomed an average of 6 to 7 months into the recession (the average recession has lasted 11 months). But this average masks a lot of variability. There have been important bear markets that lasted longer. The market bottomed 18 months after the beginning of the 2001 recession and 10 months after the start of the 1973 recession.

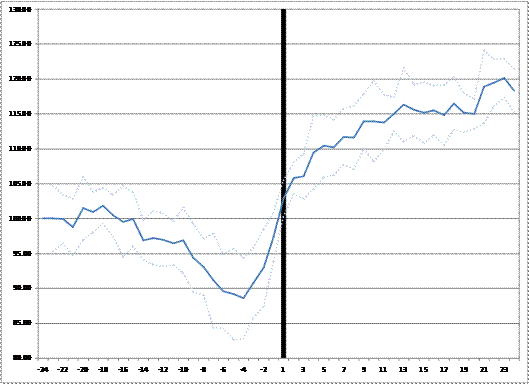
Given the variable length of recessions, we can examine the data from a different perspective. Instead of asking how long it takes for stock prices to bottom once a recession starts, we can ask how many months prior to the end of a recession do stock prices begin to advance from their lows.
The last graph below changes the reference point. The vertical black line shows the end of each recession. The blue line is the change in the S&P 500 two years before and after that point. Although the common rule of thumb is that markets bottom six to nine months prior to the economy turning up, the S&P 500 has actually bottomed closer to four or five months prior to the end of recessions. The market is a discounting mechanism. It's not clairvoyant.

The time-frames backed out of this analysis are intended to provide general perspective, not to provide specific points to expect turns or make investment decisions. There is too much variance in the length of recessions and the behavior of stocks to count on their average performance. But it's important to keep in mind that stock market declines triggered by the onset of a recession tend to be longer and the losses more severe than the results for the “average” bear market.
This should give you some idea of what we're up against, I'm sticking with the general outline from "Markets: I Scream Triple Dip", since we're in dip #2 now, the question becomes the point of this post, "Where is the bottom?"
We'll have the third "lower low" (and it could be a drawn out doozy) should we go into the double recession I was looking for in MISTD. Which reminds me of a road-trip Dairy Queen some years back, gotta go...