Data up front:
2026-08-25 22.53 77.47 56.61 31.59 11.76 1.75 179 2026-08-18 23.79 76.21 52.70 29.87 10.60 1.35 171 2026-08-11 26.38 73.62 50.38 29.50 10.27 1.04 165 2026-08-04 29.05 70.95 48.54 28.57 9.51 0.95 159 2026-07-28 32.08 67.92 47.89 28.30 10.00 0.86 155 2026-07-21 34.76 65.24 45.77 29.14 10.71 0.93 152
This is a 0 (wetter than water) to 500 (dryer than the driest desert) scale.
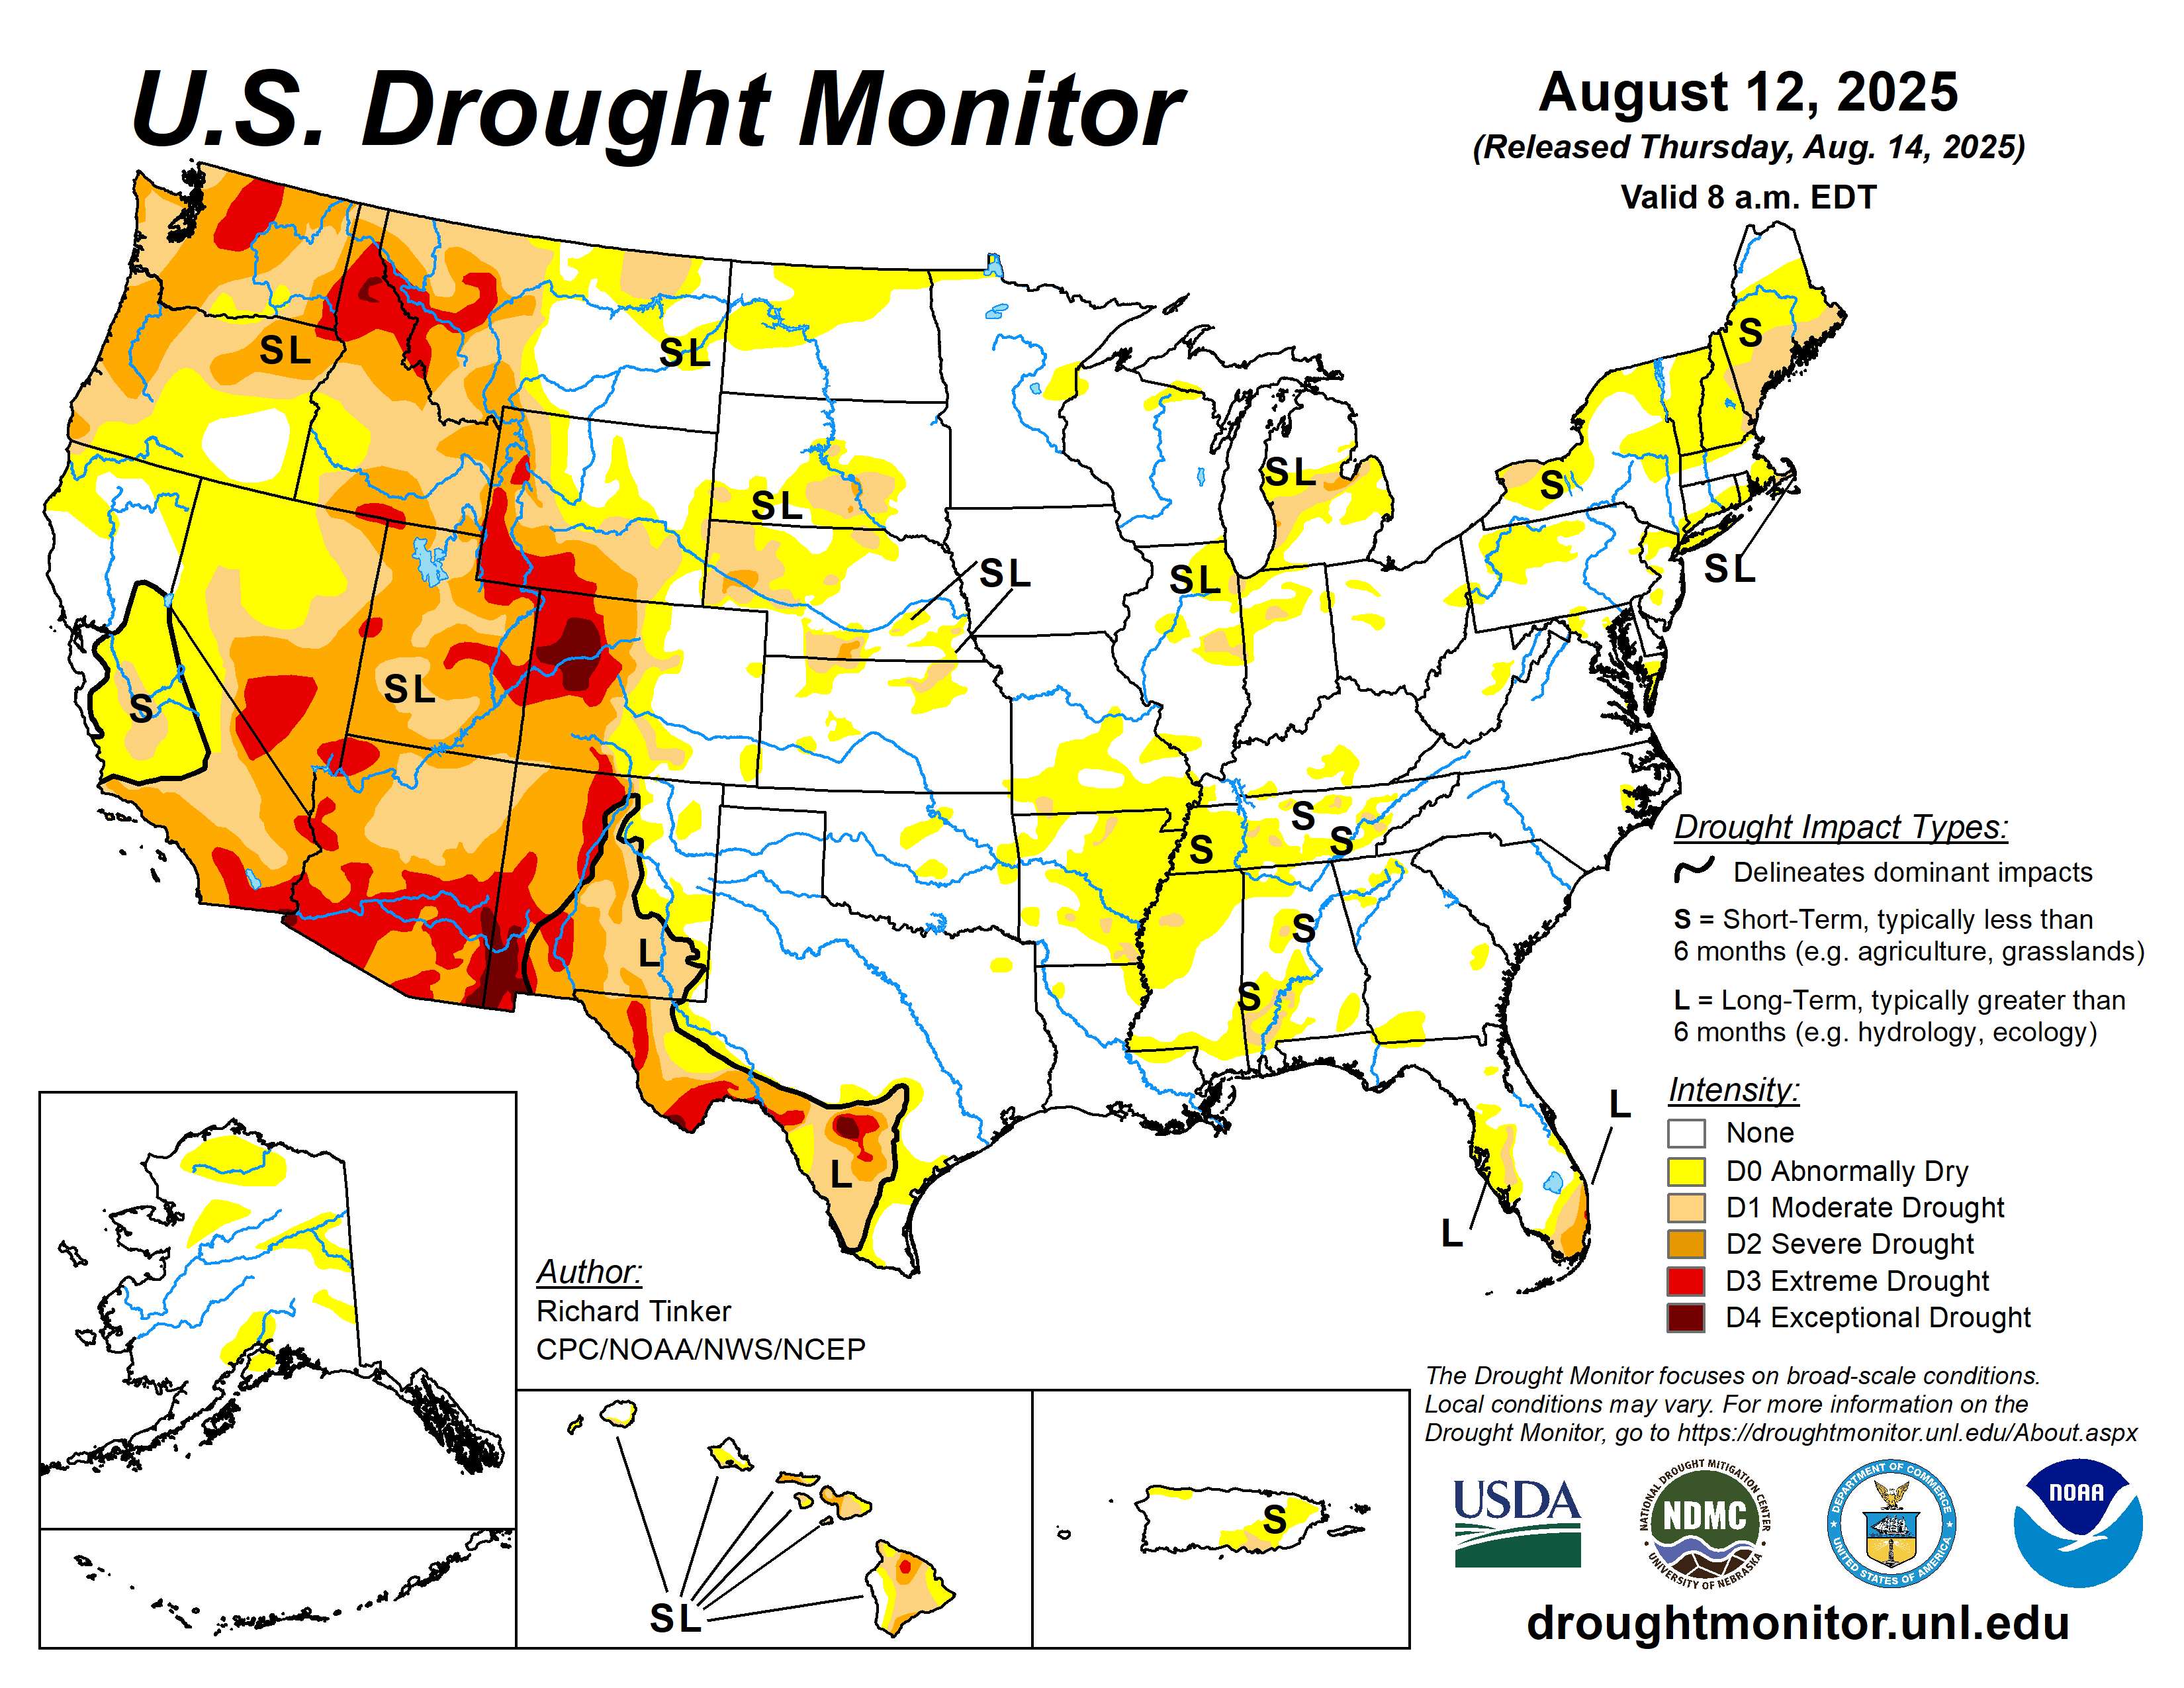
The table and maps + commentary are from the University of Nebraska-Lincoln, August 27:
This Week's Drought Summary
During the early part of last week, an amplified ridge-trough pattern over North America brought widespread late summer heat to the West and south-central US, with milder temperatures overspreading the Corn Belt and gradually shifting to the Northeast and mid-Atlantic states. The north side of the mean ridge provided a focus for convective activity, with narrow swaths of locally heavy rainfall extending across Nebraska and Missouri, while shortwave troughs brought several rounds of storms to the eastern Corn Belt and parts of the mid-Atlantic and southern New England. Underneath the ridge, dry weather combined with excessive heat continued to promote rapid onset drought across much of the South region. Across the Southeast, summer convection competed with enhanced evapotranspirative demand due to hot temperatures, causing some degradation in areas that missed out on thunderstorm activity. Across the West, an active monsoon pattern continued to bring localized relief to parts of Arizona and New Mexico, while excessive heat and drier conditions promoted drought expansion across eastern New Mexico and portions of the Intermountain West, Great Basin, and the Northwest....
....MUCH MORE

