One of the most difficult tasks for historians is translating the value of assets, commodities and wages across centuries, much less millennia.*
From Asterisk Magazine:
Everyone loves the hockey stick graph of long-run economic growth. For some, it's the basis of an entire worldview. Unfortunately, the numbers don’t add up.
Whenever life gets you down, look up the Hockey Stick of Long Run Growth.
You’ve surely seen it before — those measurements of GDP which stretch back to antiquity and, post-1800, show an explosion of economic growth.
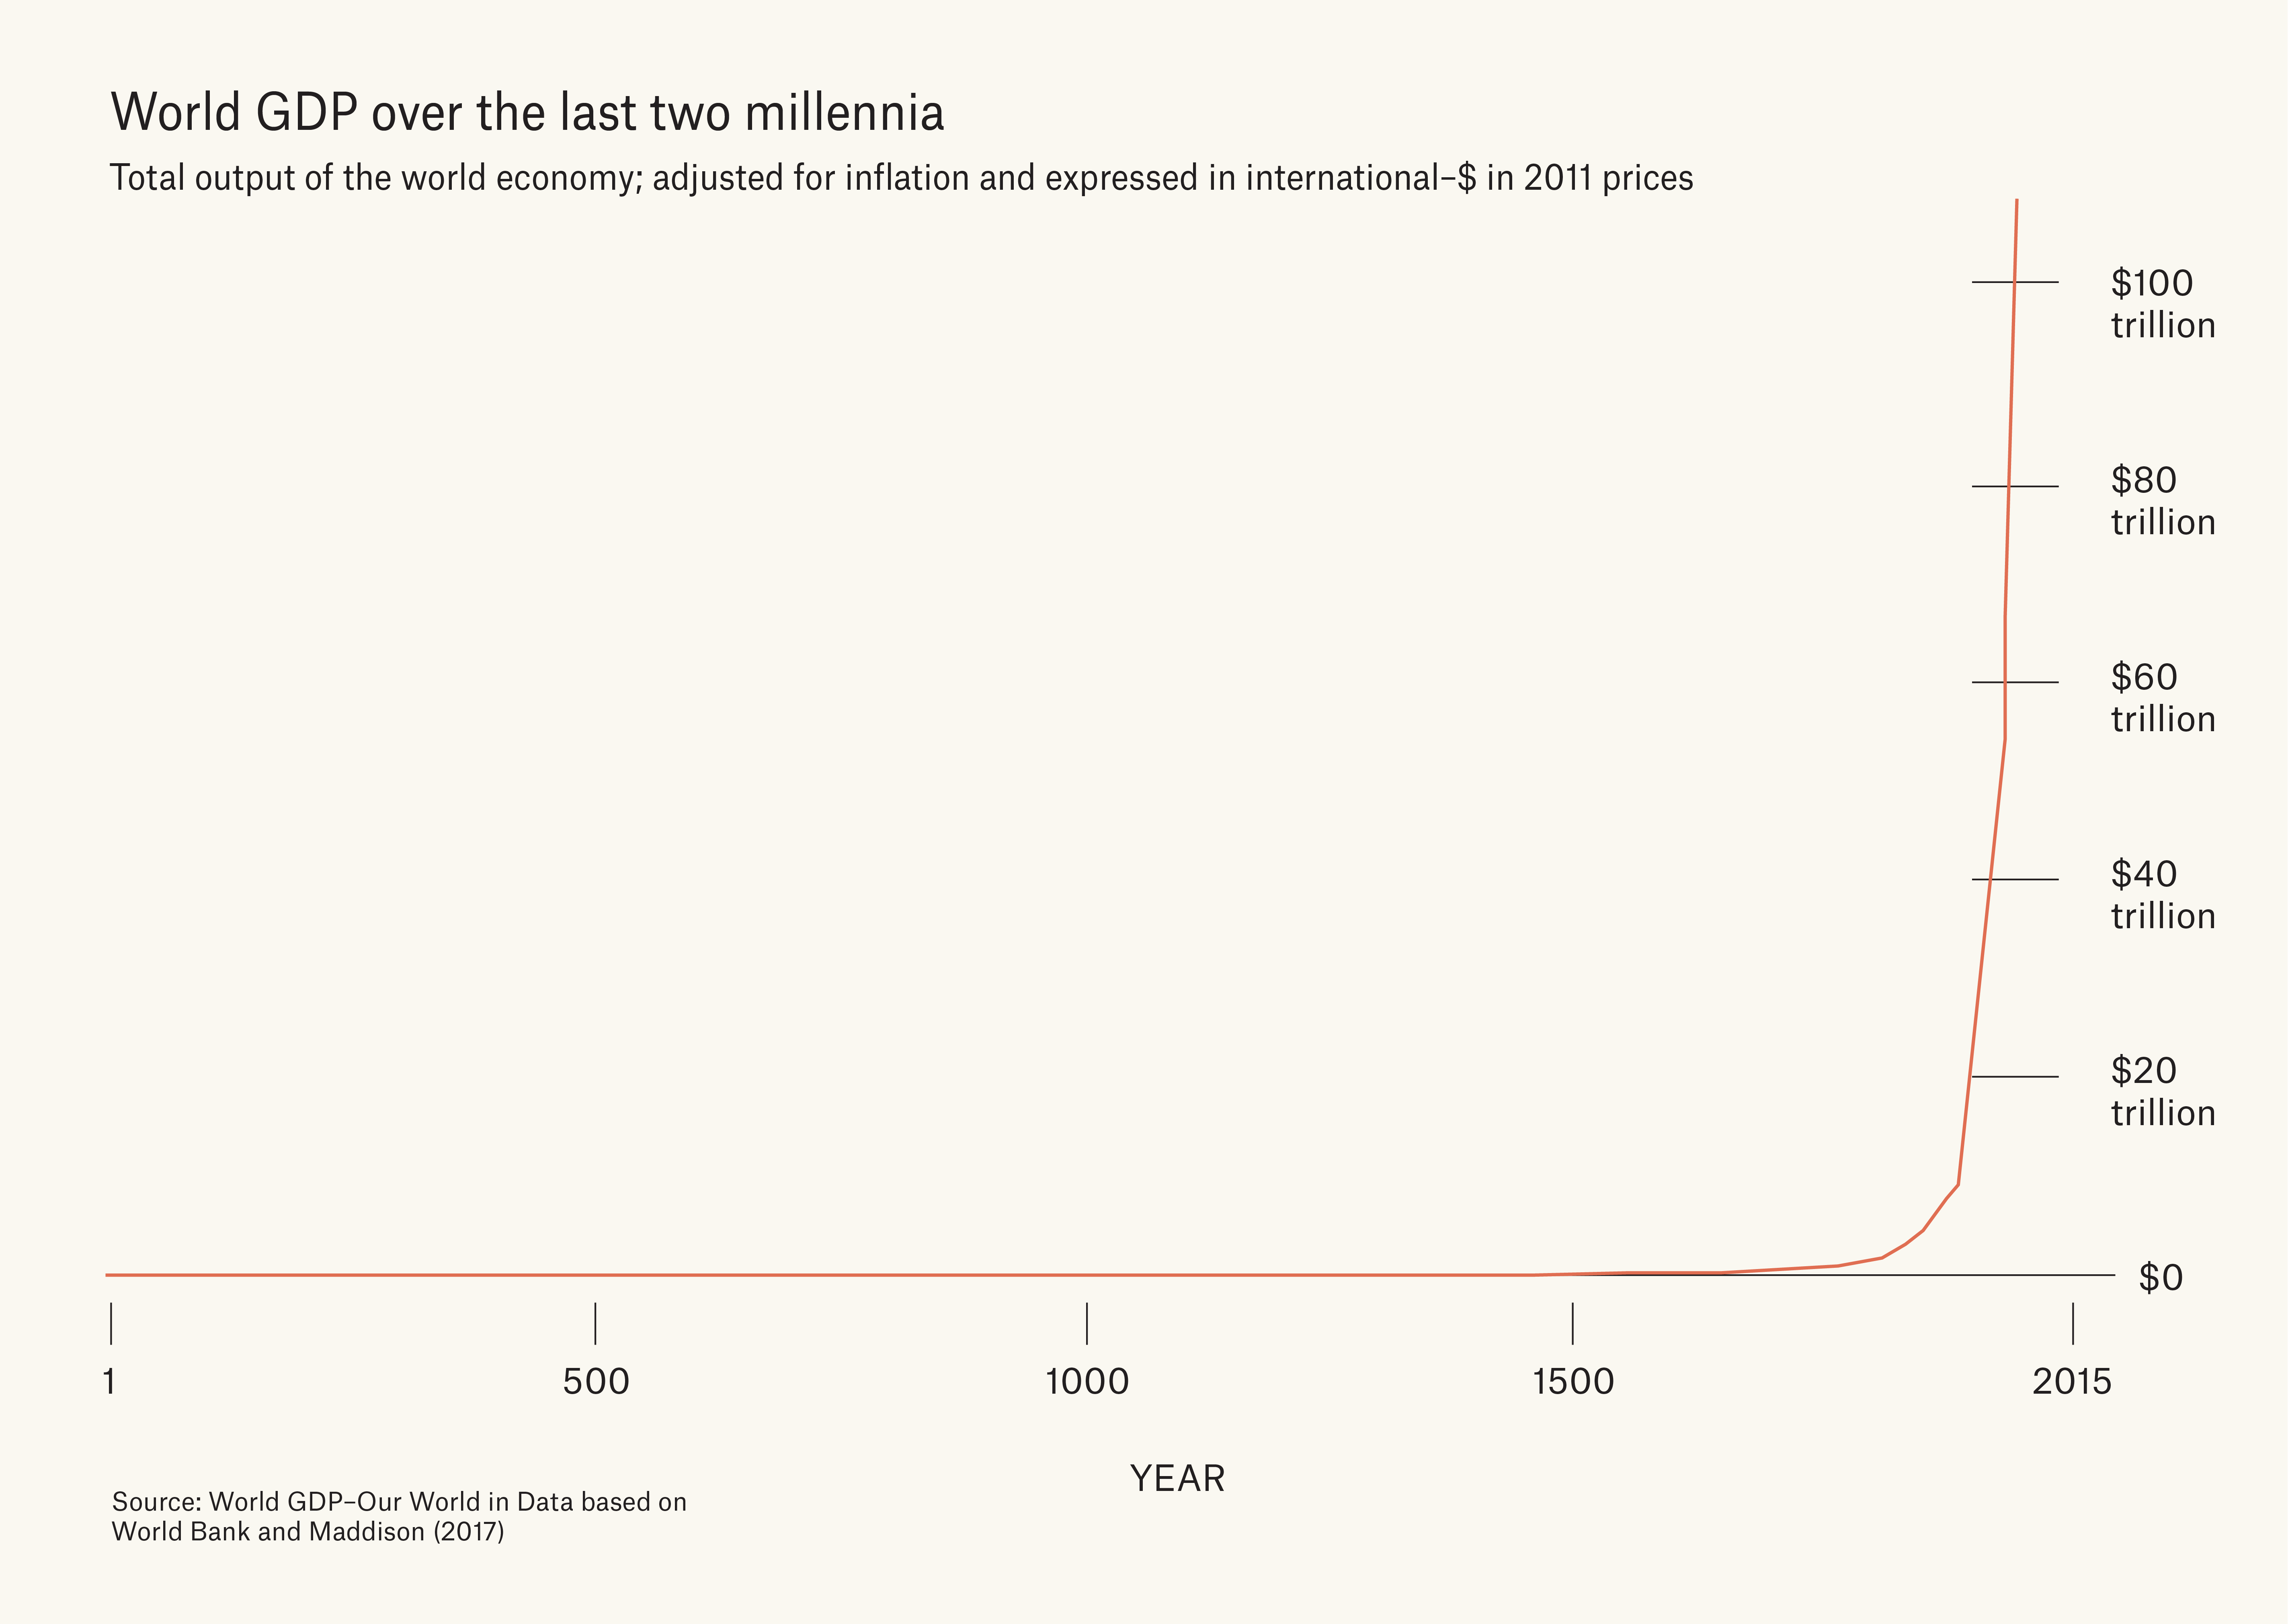
For a certain type of nerd — the kind who knows their spinning jennies from their water frames, weeps silently at museum steam engines, and includes, perhaps, this writer — seeing that line rocket upwards triggers a certain frisson. Within that slender line is condensed so much of humanity’s material progress, its scientific and technological achievement, its grasping towards the possibility of lives that are a little less nasty, brutish, and short.
The Hockey Stick of Long Run Growth has acquired a life of its own as a sort of emblem of belief in the potential for human progress. It has been printed in textbooks, sewed onto hats and, in all likelihood, has somewhere been tattooed on human flesh.
All very well and good, but for one nagging question.
Which government bureau was collecting GDP statistics in the 1st century?
Economic archaeology
Most long-run GDP data can be traced back to a single source: the Maddison Project, named for the late British economist Angus Maddison, who built an august academic career on the art of historical GDP estimation.A self-proclaimed chiffrephile — one who loves numbers — Maddison brought quantification to places where historians previously feared to tread. Thanks to his efforts, historical GDP estimates were brought back to 1820, then to 1000, then in one giant leap, back to the birth of Jesus Christ. After Maddison passed away in 2010, his intellectual heirs at the University of Groningen picked up the work, updating his estimates with the latest findings from economic history research.To get to the heart of the matter, in its latest 2023 release, the Maddison Project estimates that in 1 CE, Roman Italy had a GDP per capita of $1,407 in 2011 purchasing power parity dollars. Elsewhere in the Roman Empire, Greece had a GDP per capita of $1,275, roughly 10% less than Italy; Egypt, a breadbasket of the Mediterranean world, had a GDP per capita of $1,116, roughly 25% less.
By expressing everything in the common units of 2011 purchasing power parity dollars, the Maddison dataset enables mind-boggling jumps across both space and time. For instance, Romans in Italy transported to 2022 would be counted among the poorest people in the world — somewhat poorer than the average Madagascan (GDP per capita $1,367 in 2011 PPP dollars), but somewhat richer than the average Malawian ($1,190). A modern Roman, at $36,224 per capita, is around 26 times richer than her ancestors in 1 CE.
The Maddison estimates’ appeal likely lies in how they immediately help us grasp history in quantitative terms. On the one hand, they give us a sense of the scale of material transformation since the Industrial Revolution: denizens of one of the richest premodern societies on the planet lived in material poverty we commonly associate with the developing world. On the other hand — a still grimmer thought — people in present-day developing countries are living in material conditions comparable to those 2,000 years ago.
But to return the original question — who was collecting survey data in the reign of Augustus Caesar? Where do these GDP numbers actually come from?
What have the Romans ever done for us?
We can immediately dispel the notion that there was anything close to a Roman Bureau of Statistics. The Romans were pioneers in census-taking, road-laying, and aqueduct-building, but any notion of systematically estimating national wealth or income would have to wait until at least the 17th century.All of the Maddison Project estimates for 1 CE come exclusively from a 2009 paper by Walter Scheidel and Steven J. Friesen, who make a valiant latter-day effort to piece together Roman GDP from the fragments of surviving evidence. From the middle of the first to the middle of the second centuries, Scheidel and Friesen have precisely one price of wheat for all of Roman Egypt. For unskilled workers’ wages (measured in terms of wheat), they have three sources: Diocletian’s price edict of 301 CE, papyri from the mid-first to second centuries, and papyri from the mid-third century.Triangulating three sets of estimates from these scattered observations, Scheidel and Friesen arrive at a final total GDP estimate of 50 million tons of wheat at the Empire’s population peak around the mid-second century CE, with a per-capita consumption of 680 kg of wheat or equivalent grains. 1 If we say that subsistence is 390 kg of wheat, and assume that subsistence is worth $400 in 1990 PPP dollars, this translates to $700 in 1990 PPP dollars, giving us the $1,116 in 2011 PPP dollars for 1 CE. (1 CE is still a hundred-odd years off from Scheidel and Friesen’s chosen data point in the mid-second century, but no matter.)....
If interested, you may want to dip into the big daddy of price series:The value of money has something of an anchoring effect on the post-neolithic mind—and though it is one of the greatest challenges for historians—enables rough (sometimes very rough) comparisons across decades, centuries and millennia.
You can judge how much a loaf of bread cost an urban Parisian family in hours of labor necessary for its procurement, over multi-generational time frames. And why in countries where a large percentage of income goes to food or shelter, why increases in the price of those items leads to riots, civil war and revolution.
When the anchor isn't holding firm people feel it and though they may not be able to articulate what they are feeling, know that it's real.....
by J. E. Thorold‐Rogers, 7 volumes, 1866-1887 which probably influenced Jevons.
Here's another bit o'price series scholarship:
the years 1200-1914 using 26 component series: wheat, barley, oats, rye, peas,
beans, potatoes, hops, straw, mustard seed, saffron, hay, beef, mutton, pork,
bacon, tallow, eggs, milk, cheese, butter, wool, firewood, timber, cider, and
honey. I also construct sub-series for arable, pasture and wood products. The
main innovation is in using a consistent method to form series from existing
published sources. But fresh archival data is also incorporated. The implications
of the movements of these series for agrarian history are explored.