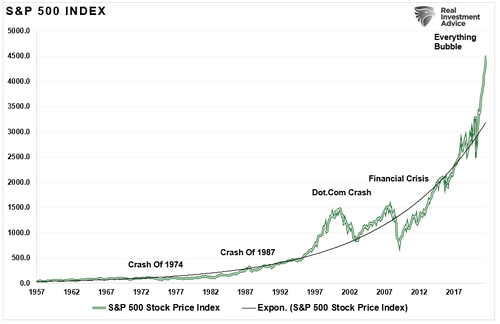
We'll highlight just one chart from this article, in part because analogs, though interesting, only get you so far. As we and many others have pointed out (Hi Izzy) humans are pattern-seeking animals and we are so good at it that we can see patterns that aren't even there!
From RealInvestmentAdvice via ZeroHedge:
Japanization: The S&P 500 Is Tracking The Nikkei Of 1980
....look at this monthly chart of the S&P 500 below.
While the liquidity-fueled rise in the market from the financial crisis low was substantial, it wasn’t as abnormal as it seemed as it tracked along with the exponential growth trend line. Such was also the case from 1957 to 1995....
....MUCH MORE
As NASA points out:
...Achieving escape velocity is one of the biggest challenges facing space travel. The vehicle requires an enormous amount of fuel to break through Earth's gravitational pull. All that fuel adds significant weight to the spacecraft, and when an object is heavier, it takes more thrust to lift it. To create more thrust, you need more fuel....
More fuel.
In this case the fuel is money/credit flooding into asset markets.
note: the above is intended as a joke but if you can calculate what happens if there isn't quite enough fuel and we end up with a ballistics problem, if you can calculate the height at which we achieve apogee before turning back down, do send up the bat signal. Wait, no bat signal. No bat cave. Nothing to do with bats. Viruses.
Write a letter to the editor of the FT or WSJ, we'll see it.
In the meantime, more fuel.
