This is a pattern we saw going into the bear markets of 2000 - 2002 and 2008 - 09.
We've also seen it a half dozen times where big bears didn't follow, so it is not an infallible indicator, just something to be aware of. If the generals get too far out in front of the troops they risk finding the truth of what Congresswoman Virginia Foxx (R. NC) said to Liz Cheney when Rep Cheney thought she was a leader of her caucus:
"A leader with no followers is just a person on a walk”
From StockCharts, July 2:
The S&P 500 is going higher. If you knew nothing else about the current market environment, you would consider that to be a bullish indication. As Paul Montgomery once said, "The most bullish thing the market can do is go up."
But if you look underneath the hood, you'll see the breadth measures are mixed to negative. Advancers-decliners are not confirming this week's new all-time highs on the major averages. Only 56% of the S&P members are above their 50-day moving averages. And the equal-weighted S&P is underperforming the cap-weighted S&P.
What does all the above mean? This is a narrowly led market driven by large cap growth stocks. The real question is, does it matter?
Let's review each of these three charts, talk about the current configuration and what we would need to see for a more bullish breadth picture. First, we have the cumulative advance-decline lines of the NYSE (common stock only), the S&P large-cap, mid-cap and small-cap indices.
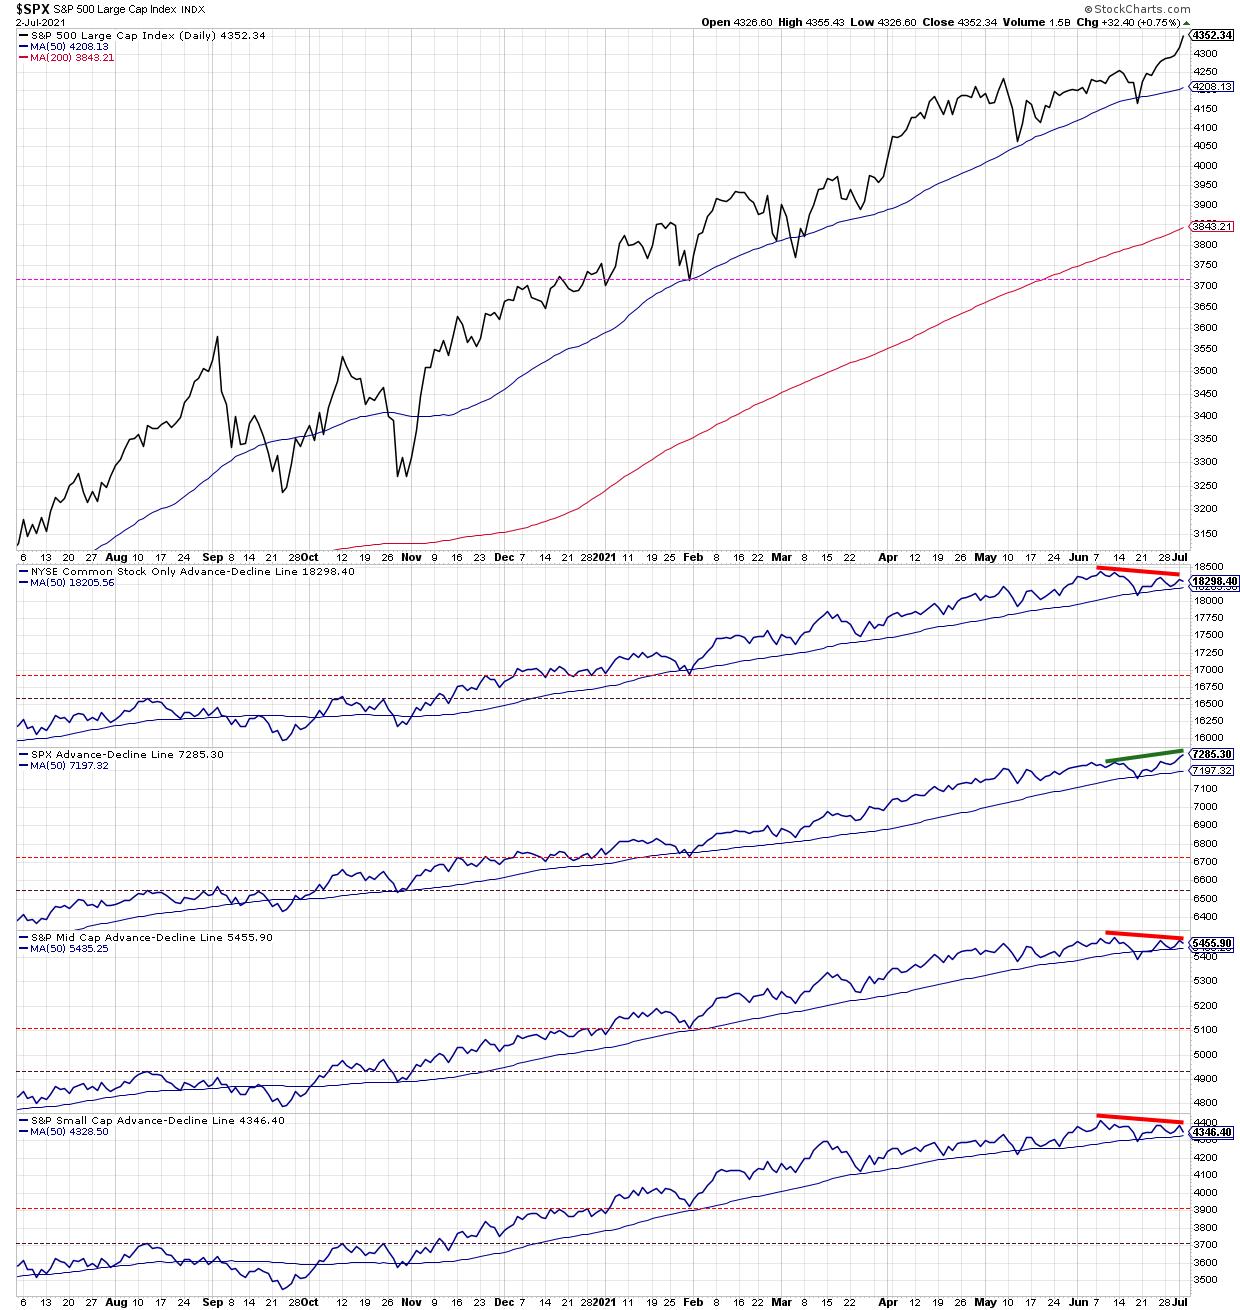
Only one of the four advance-decline lines has confirmed this week's new highs, and that's the one for the S&P 500 itself. That means that for mid-caps, small-caps and the broad NYSE common stock universe, we have made lower highs in terms of breadth. This suggests that while large-caps are pushing higher, lower-cap tiers are not participating in the most recent upswing....
....MUCH MORE