Following on the dark clouds in the post immediately below we have one of the scarier chart formations to be found in the land of portents and omens. (otherwise known as technical analysis):
Those are the futures (continuous contract) but you see the same pattern in the index (RTY) and ETF (IWM).
The thinking upon seeing this formation is that each drop/recovery absorbs more and more of the available buying power at whatever level the downside resistance forms and that, should the pattern keep recurring eventually all the buying power is exhausted and the next test results in a giant "Whooshing" sound and the decline can get vertical on the chart until the next level of buying initiated transactions is found at lower prices. It works the same way on the upside with each test absorbing more and more of the selling pressure until there is none, resulting in the sort of pop you get from releasing a cork you've been holding underwater.
Or something.
The current set-up was first brought to our attention by Tim Knight at Slope of Hope, July 26 pre-market:
Speaking of Support
Well, there you have it. As required by federal statute, once the Russell 2000 futures reached their zone of support, boom, the buying started. Let’s take a look at what /RTY has been doing in recent days:
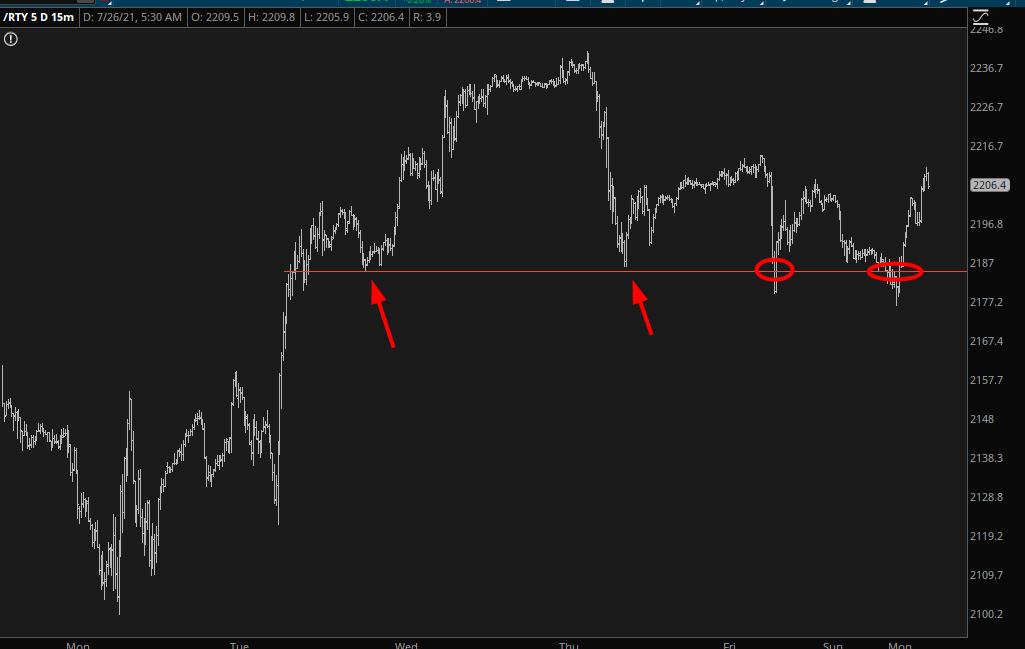
So reading from left to right, you can see the first arrow marks support. After a surge to lifetime highs and a hard fall, the same level is reached again, followed by buying, albeit at a less furious pace. The market weakens and actually punctures support....
....MUCH MORE