A topic near and dear to our jaded hearts.
This is a real problem, whether you call it "Marginal Productivity of Debt" or "Debt Saturation" or "Bang-for-the-Buck", we are running faster and faster just to stay in place. This is not a new phenomena, the piddly 6.5% GDP growth we just saw, despite the trillions and trillions in new debt is just the latest example.
Here's an example from 2012:
The Real Problem With Stimulus
I've mentioned a few times that Keynes was all about the countercyclical thing.
In the U.S. we have devolved to perma-stimulus, every dollar of deficit spending being stimulus, and have no plans to ever stop. Anyone who argues that stimulus isn't stimulus unless it is labeled stimulus is being sillier than I felt when I typed this sentence.
Deficit spending is stimulus whether you call it ARRA,sweet, sweet Biden loveor Democracy's flaw.....
The Biden reference is to the fact the former Vice-President was overseer of the ARRA stimulus in 2009 - 10 and the Recovery Summer in 2010.
And from RealInvestmentAdvice, June 21, 2021:
The Zero To Negative Multiplier Of Debt On Growth
There is a zero to a negative multiplier of debt on economic growth. The recent spending spree of the Government to facilitate a transition to a socialistic economy is problematic.
“The scale and scope of government spending expansion in the last year are unprecedented. Because Uncle Sam doesn’t have the money, lots of it went on the government’s credit card. The deficit and debt skyrocketed. But this is only the beginning. The Biden administration recently proposed a $6 trillion budget for fiscal 2022, two-thirds of which would be borrowed.” – Reason
The CBO (Congressional Budget Office) recently produced its long-term debt projection through 2050, ensuring poor economic returns. I reconstructed a chart from Deutsche Bank showing the US Federal Debt and Federal Reserve balance sheet. The chart uses the CBO projections through 2050.
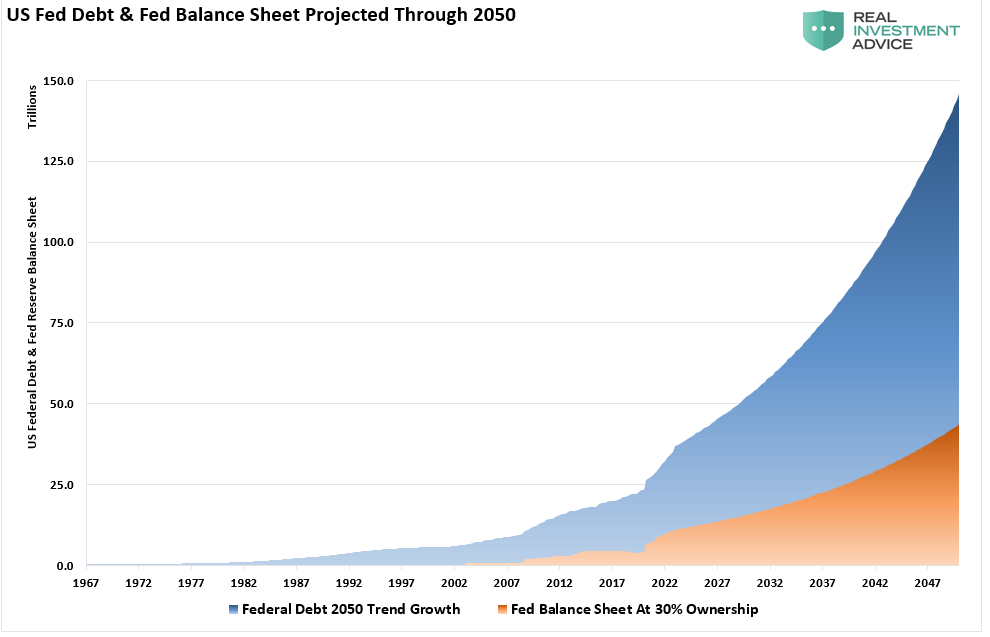
At the current growth rate, the Federal debt load will climb from $28 trillion to roughly $140 trillion by 2050. Concurrently, assuming the Fed continues monetizing 30% of debt issuance, its balance sheet will swell to more than $40 trillion.
Let than sink in for a minute.
More Debt = Less Growth.
What should not surprise you is that non-productive debt does not create economic growth. As Stuart Sparks of Deutsche Bank noted previously:
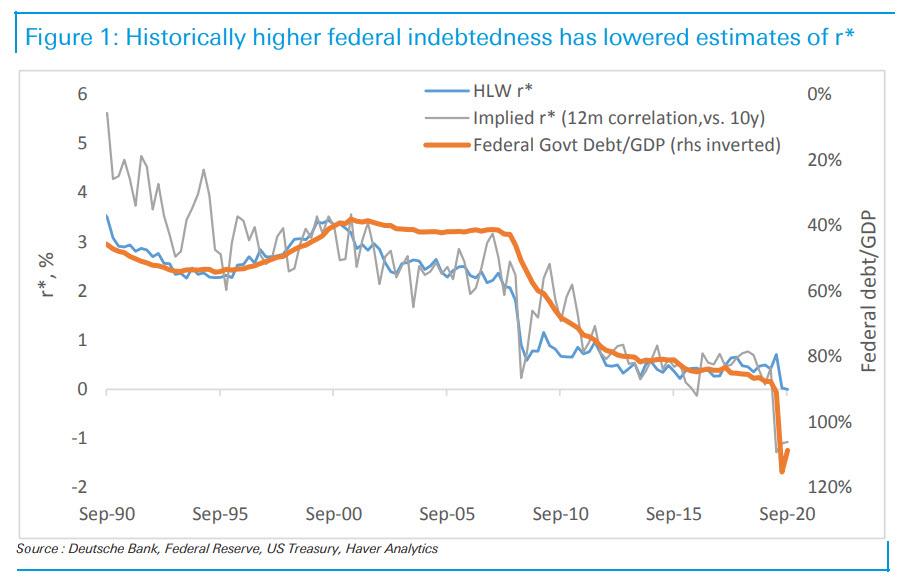
“History teaches us that although investments in productive capacity can in principle raise potential growth and r* in such a way that the debt incurred to finance fiscal stimulus is paid down over time (r-g<0), it turns out that there is little evidence that it has ever been achieved in the past.
The chart below illustrates that a rising federal debt as a percentage of GDP has historically been associated with declines in estimates of r* – the need to save to service debt depresses potential growth. The broad point is that aggressive spending is necessary, but not sufficient. Spending must be designed to raise productive capacity, potential growth, and r*. Absent true investment, public spending can lower r*, passively tightening for a fixed monetary stance.”
A long-term historical look confirms the same. Since 1977, the 10-year average GDP growth rate steadily declined as debt increased. Using the historical growth trend of GDP, the increase of debt will lead to slower economic growth rates in the future....
....MUCH MORE
Not only does each dollar of debt buy less and less growth but as we learned with ARRA and The Recovery Summer, the growth it does buy is actually just pulled forward from future years, to the point that by eating our seed corn today we are guaranteeing we are starved for growth in just ten years.
RIA's next chart has ten-year average growth going permanently below 2% in 2032 and permanently below 1% by 2047 i.e. within our lifetimes. Those dates seem optimistic though. Let's say 2030 and 2043.
And it is baked in the cake, there is no way out.
HT: ZH