Published on: October 24, 2019
Original title: 2018年1-9月全国电力工业统计数据一览表
Links: Source document (in Chinese) (link). Same statistics for (Q3 2018) (Q3 2017) (Q3 2016) (Q3 2015) (Q3 2014) (Q3 2013) (Q3 2012) (Q3 2011) (Q3 2010) (Q3 2009).
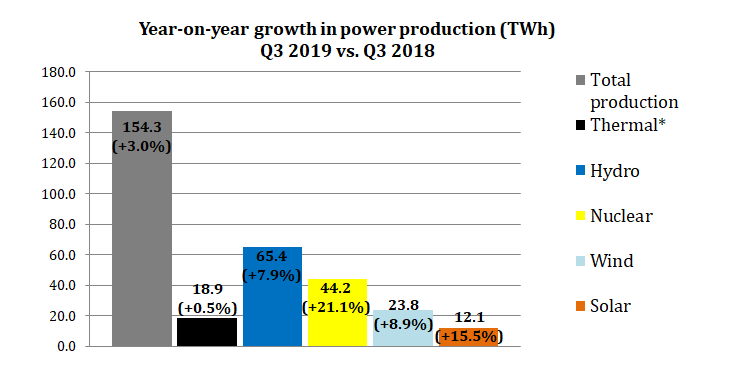
[Note graph is Q3 2019 year to date versus Q3 2018 year to date. *Thermal includes coal, gas, oil, and biomass]
2019年1-9月全国电力工业统计数据一览表
Indicator Unit Year to date YoY change (±, % or % point) National total power production GWh 5,296,700 3.0 Of which: Hydropower GWh 893,800 7.9 Thermal power GWh 3,802,000 0.5 Nuclear power GWh 253,800 21.1 Wind power GWh 291,400 8.9 National total power consumption GWh 5,344,200 4.4 Of which: primary industry power cons. GWh 58,100 4.7 Secondary industry power cons. GWh 3,585,700 3.0 — Of which: industrial power cons. GWh 3,520,100 2.8 Tertiary industry power cons. GWh 899,400 8.7 Household power cons. GWh 801,000 6.3
...MUCH MORE