However...
Using the iShares MSCI Emerging Markets ETF (EEM) as our proxy, the emerging stocks are tied with S&P 500 at around an 11% gain over three months and are running ahead of the gain in the S&P by 6.5% to 3.3% in the last month.
Additionally, news last week: "Norway to cut major emerging markets from the sovereign wealth fund’s fixed-income benchmark" is implicitly an increase in the equity side of the big fund's emerging stock/bond balance because math.
it's also a bit of confirmation bias on my part because I haven't been able to get this quote out of my head since the day I read it:
"Emerging market speculation tends to appear at a juncture in the economic cycle when
declining yields on domestic bonds combine with an excess of capital to make
foreign investments particularly attractive."
-Edward Chancellor
Chapter 4, Fool's Gold: The Emerging Markets of the 1820's
So, as is our wont, we'll hear the passing parade and try to run to the head of it.*
From StockCharts
RSI Shifts from Bearish to Bullish for EEM
The Emerging Markets ETF (EEM) experienced a trend-momentum shift over the last few months as RSI moved from its bear range to its bull range. In addition, RSI came close to 70 (69.5) twice and EEM broke above its 200-day SMA. The downtrend reversed and I expect higher prices until the evidence proves otherwise.
The chart below shows EEM falling into October 2018 and then firming in the last two months of the year. EEM actually showed some relative strength from October to December because it forged a higher low when SPY forged a lower low. This is partly due to strength in China because Chinese stocks account for a third of the ETF. EEM went on to break resistance at the November-December highs and moved above its 200-day SMA. Most recently, the ETF consolidated above the 200-day and broke out of this consolidation this week. Price action is clearly bullish.
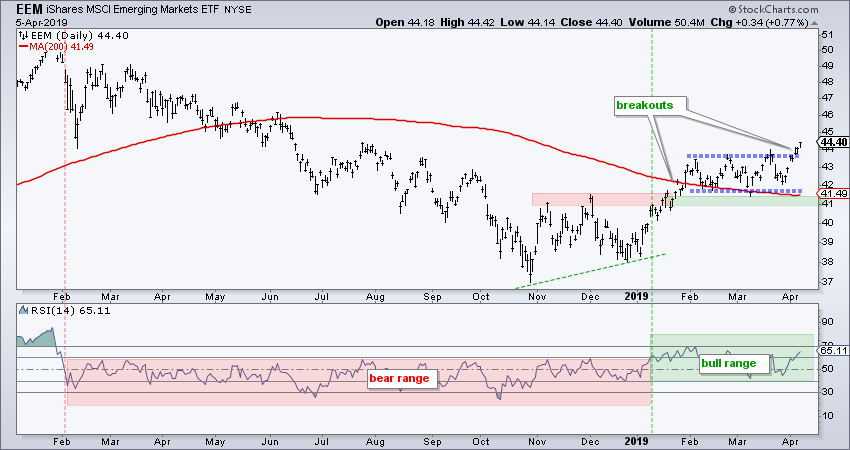
The indicator window shows RSI moving from a bear range to a bull range in January. Notice how RSI traded between 20 and 60 from February 2018 to January 2019. RSI broke above 60 in January and has since held above 40. This puts RSI in its bull range (40 to 80) and suggests that the trend-momentum cup is half full....MORE*Stealing a page from Alexandre Auguste Ledru-Rollin:
"Il faut bien que je les suive, puisque je suis leur chef"
Schoolboy French translation: "I must follow them for I am their leader."