Should this scenario play out, and knowing Warren's almost chameleon-like promotional abilities, I would expect him to begin buffing his already-verdant green credentials and in particular those of the former Mid-American Energy division, now renamed Berkshire Hathaway Energy, which, under disgraced former heir-apparent David Sokol, became the owner of the largest wind turbine fleet in the U.S. and which, under current head Greg Abel, will become the largest single owner of utility-scale solar operations.
Just don't mention the coal.
From RBN Energy:
The End of The Line - Could Bakken Crude-by-Rail Shipments Disappear?
Bakken crude-by-rail (CBR) volumes are down this year and pipeline shipments are increasing as production levels off in the wake of last year’s price crash. The trend is encouraged by lower price differentials between domestic and international crude as well as new pipelines coming online. Since 2012 a combination of rail and pipeline has given Bakken producers ample crude takeaway capacity but pipelines alone have not had sufficient capacity on their own. However, with production slowing down, pipeline capacity is catching up and by 2017 there should be enough pipelines to carry all North Dakota’s crude to market. Today we start a two part series asking whether pipelines can replace CBR from North Dakota.
We’ve covered the transportation of Bakken crude out of the prolific Williston Basin in North Dakota quite extensively in the RBN Blogosphere. Back in 2012 Bakken production quickly outstripped available pipeline capacity – much of which had to be shared with crude from Western Canada. The result - that we now look back on as a familiar story in the shale era – was pipeline congestion and price discounting while producers tried to figure out alternative routes to market. As described in our Crude Loves Rock’n’Rail series in the first quarter of 2013 the solution was to build a plethora of CBR load terminals in the Bakken - transforming a famine of pipelines into a feast of rail. As long as the price differentials between discounted domestic crude stranded in the Midwest and coastal crude priced at higher international prices stayed wide enough – rail was an ideal option for Bakken producers – especially to the East and West Coasts where there is no pipeline capacity (see On The Rails Again). As soon as price differentials – especially between domestic benchmark West Texas Intermediate (WTI) and international benchmark Brent – narrowed then barrels shifted back to pipelines to take advantage of their cheaper tariff rates. Yet significant crude volumes continued to be transported to market from North Dakota by rail because pipeline capacity could not handle the demand. More recently we have described the planning and build out of a series of new pipelines out of North Dakota that (if they are all built) should increase capacity enough to provide space for all the barrels currently travelling to market from North Dakota by rail (see Watching the Defections – Energy East). In this blog we speculate as to when that day might come and whether it is likely.
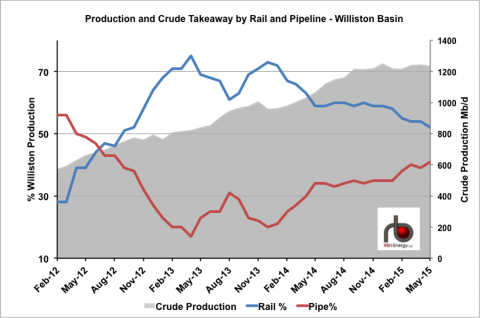
The chart in Figure #1 shows the changing balance between rail (blue line) and pipeline (red line) percentages of crude carried out of the Williston Basin since February 2012 (against the left axis). The data is from the North Dakota Pipeline Authority (NDPA) that publishes monthly estimates of the balance between crude takeaway modes in percentage terms – based on crude production from the Williston Basin as a whole. We also included the monthly Williston Basin production history as a reference (grey shaded area against the right axis) – that comes from the Energy Information Administration’s (EIA) Drilling Productivity Report (see Every Rig You Take). There are two big takeaways from this chart. The first is that crude production – and therefore the amount of crude that needs to be transported out of North Dakota is growing throughout the period – although that growth has leveled off this year in response to falling crude prices and lower drilling rates. The second big takeaway is the change in the relative positions of rail and pipeline takeaway percentages over the period. Pipelines (red line) started out in the lead back in February 2012 at 56% but fell rapidly after that to 23% in May 2013 before beginning a gradual recovery in December 2013 back to 41% in May 2015 (the latest data). Rail started out at 28% in 2012 but zoomed up to 75% by April 2013 – falling back to 61% in August 2013 when crude differentials narrowed before recovering to 73% in December 2013. Since then rail percentages have been on a steady decline – leveling off some at about 60% in the second half of 2014 but falling again so far this year to 52% in May (2015) – their lowest level since October 2012. This year through May the trend of increased pipeline and lower rail is quite pronounced as the two lines converge on the chart.
Figure #1; Source: North Dakota Pipeline Authority, RBN Energy, EIA (Click to Enlarge)
The trend in favor of pipeline transportation out of the Bakken since 2014 has primarily been prompted by the narrowing of price differentials between Brent and WTI – that averaged $18/Bbl during 2012 reducing to $11/Bbl in 2013 and $6.50/Bbl in 2014 (averaging $5.94/Bbl so far in 2015). These narrower differentials reduce the incentive for CBR because they make it harder to justify the higher cost of rail freight to coastal markets. If getting to market by rail does not increase netbacks and pipeline alternatives are available then shippers will use them first unless they have an obligation to use rail. The 60% fall in crude prices since June 2014 has amplified rail shipper’s cost concerns since they are getting less money from their crude to start with....MUCH MORE
