S&P 500 2,053.47 Down 26.14 (1.26%)
Wilshire 5000 21,589.79 Down 285.12 (1.30%)
I'm guessing, and this is strictly a guess, that we are seeing a fake-out shakeout before surpassing that 20May 2,134.72 all time high on the s&P.
From Slope of Hope:
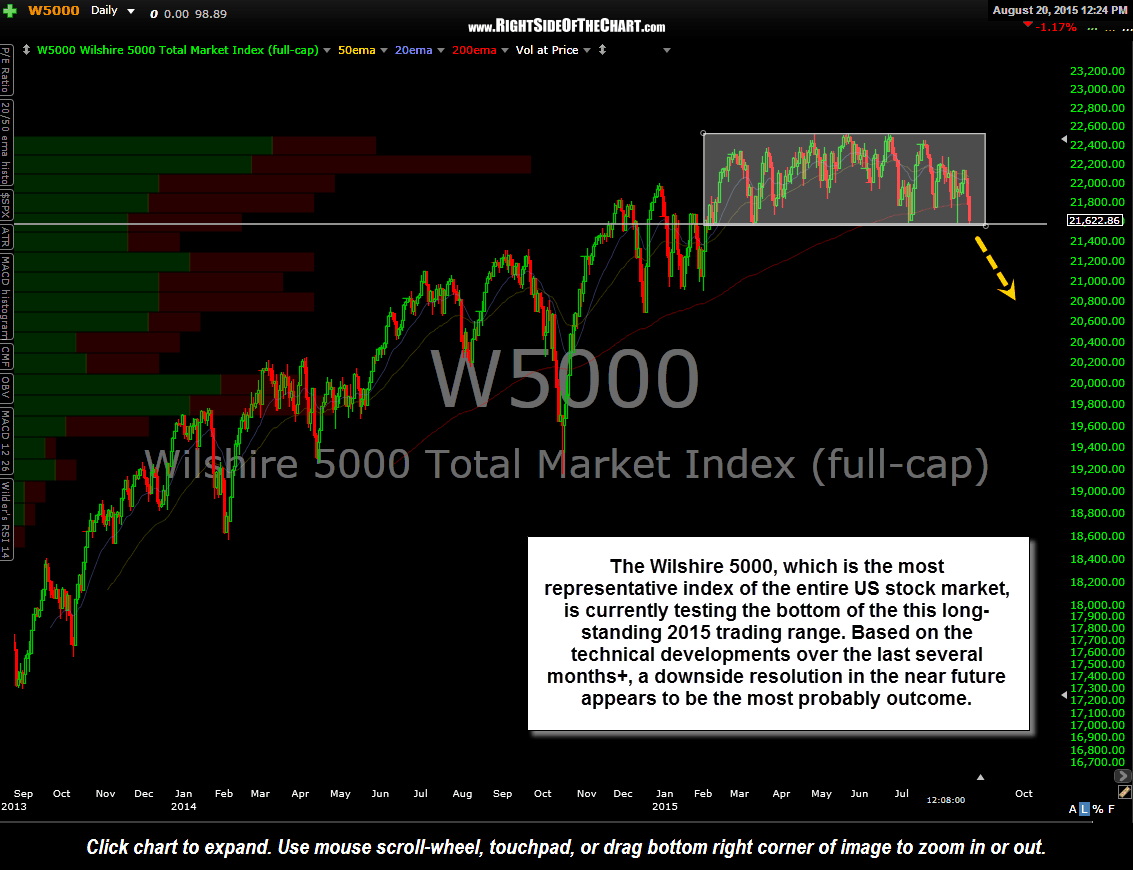
The Wilshire 5000, which is the most representative index of the entire US stock market, is currently testing the bottom of the this long-standing 2015 trading range. Based on the technical developments over the last several months+, a downside resolution in the near future appears to be the most probably outcome.
As highlighted on this weekly chart below, stocks tend to fall much faster than they rise, often wiping out months of gains in days or weeks or even years of gains wiped out in mere months during bear markets. As such, long-side only traders & investors have the potential to avoid giving back gains or mitigating losses during corrections & bear markets while flexible (long & short-side) traders have the potential to realize above-average gains with relatively short holding periods.......MORE