From Inside Futures:
OBVIOUSLY IF THE NYMEX/GLOBEX NATURAL GAS MARKET HOLDS HERE AND GOES ON TO MAKE NEW HIGHS, THEN IN MY VIEW WE HAVE REAL SUPPORT.
Fundamentally,
It's damn cold here in Chicago. I have lived here since January 2005
and this is as cold as I can remember. Not just a sub-zero day here or a
sub-zero day there, but sub-zero temperatures for long periods of time.
Today for example, the temperature at 5 a. m. central time when I woke
up was -11 degrees. Now that is forgetting the "wind-chill" temp or what
they call the "feels-like" temp, it's just the temperature. The high
for the day today was supposed to be 5 degrees above! They got snow in
Atlanta and in Louisiana yesterday for goodness sake!
In fact in
Atlanta, there has been thousands of accidents and children had to spend
the night in school because it was too unsafe to drive home. Here in
Chicago a few inches of snow or even a foot of snow is no big deal. We
have the plows and the salt trucks. Not so much in Atlanta, there are
just not prepared for this type of thing. "Why", you ask? Because it
DOESNT SNOW IN ATLANTA!! Well it did and it shut down the city.
The
"Polar Vortex" and the "Yankee Clipper" are two phrases that if I never
hear again in my life I will be just fine. I think records are being
broke right and left for low temperatures. In fact, the other day there
was a pile up on an interstate I-94 in Indiana of more than thirty
vehicles with a large majority of them being semi-trucks. Unfortunately 3
were killed....
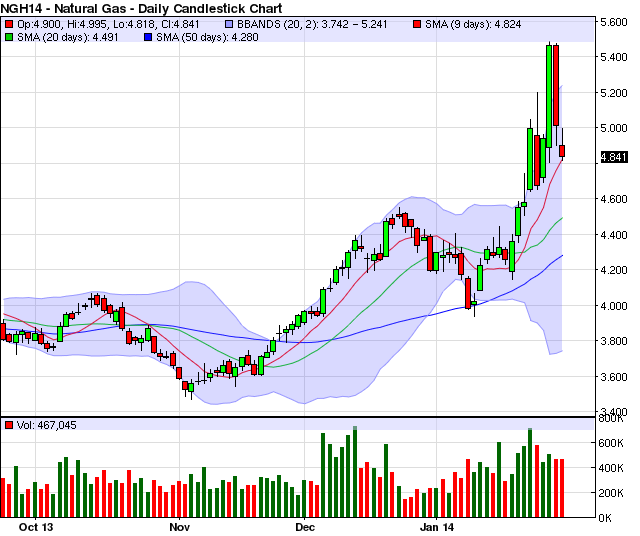
Technically, on this MARCH NATURAL GAS FUTUTRES chart I have applied
my favorite technical indicators like the 9, 20, and the 50 day SIMPLE
MOVING AVERAGE (SMA's), the BOLLINGER BANDS (BB's, light blue shaded
area), VOLUME, and CANDLESTICKS (green and red bars where each bar
represents a day).
Technically, my favorite indicators show me
that the NYMEX NATURAL GAS FUTURES market is in what I refer to as a
"SUPER-TREND" up. This begins to occur when the 9 day SIMPLE MOVING
AVERAGE (SMA, red line) crosses up and over the 20 day SIMPLE MOVING
AVERAGE (SMA, green line) and this happened on January 23rd according to
the daily chart below. The next important factor in forming a
"SUPER-TREND" up is that both indicators have to point upward on fairly
sharp angles and they did almost immediately after the cross. Finally,
the market has to trade above the 9 day SMA and then I feel comfortable
in calling the market in a "SUPER-TREND" up. All of those items are in
place here and who knows how long this trend could stay higher, but my
first boss in this business always told me, "the trend is your
friend..".
It is also important to note I believe that the market
has pulled back well off of the highs for the move. In fact it has
pulled back to what I would consider the first area of support, the 9
day SMA (red line). Now if it is real support and the "SUPER-TREND" is
to stay in effect then the market should hold here and go on to make new
highs. If not, then I look for the market to stay in an upward trend,
pull back to the 20 day SMA (green line) and hold there. Stay tuned and
let's see how my favorite technical work out.
DAILY MARCH NATURAL GAS FUTURES CHART
...
MORE