Switching on a Dime – How Power Burn is Driven by Plant Fuel Costs
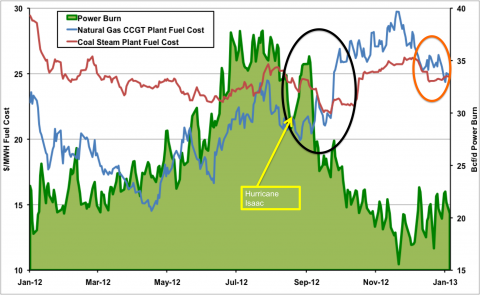
We learned from our friends at Bentek this week that gas demand from the power sector averaged a record 25 Bcf/d in 2012 – nearly 20 percent higher than 2011. The increase in demand for natural gas for power generation largely resulted from system operators switching from coal plants to natural gas after the price of natural gas fell to 10 year lows in April 2012. Today we look at how power generation plant fuel costs drive coal-to-gas switching.
Back in July 2012 we took a detailed look at power generation economics to improve our understanding of the circumstances when coal-to-gas switching can happen (see Talkin’ Bout My Generation Part I and Part II). Our hypothesis then was that plant fuel costs determine whether coal-to-gas switching is economic. Plant fuel costs are calculated based on the efficiency of a generating asset not just the underlying price of coal or natural gas. We are going to recap that analysis here and then look at the complete 2012 data to see if our hypothesis panned out.
We started by looking at when coal-to-gas switching is actually feasible. The typical daily load curve pattern for power generation includes a round the clock baseload demand, intermediate or cycling demand during the crossover from off-peak to peak demand and peak demand in the late afternoon. Different generating plants are used at different times of the day to meet this changing load. Coal steam plants are usually run as “baseload” throughout the day (24 X 7) because their fuel plant cost is low and they take time and fuel to start up. Modern natural gas plants called Combined Cycle Gas Turbine (CCGT) can run as baseload but are most often run as intermediate or cycling load to meet demand as it ramps up from off-peak to peak periods. Operators use a process called economic dispatch to determine the next generating unit to run in order to meet demand. Once system reliability requirements are met then the order of “economic dispatch” is determined by plant variable costs of which fuel cost is the largest component....MUCH MORE
...Next to get an idea of how actual power burn (the quantity of natural gas consumed by power generation) compares to our plant fuel cost estimates we add the power burn data to the picture. The chart below is the same as the first with power burn data added from Bentek’s Cell Model History (green shaded area against the right axis in Bcf/d). [By the way when you look at that mountain of power burn – remember that this time last year no one would have predicted that happening.]...Source: CME Futures Data from Morningstar and Power Burn Data from Bentek (Click to Enlarge)
