From Dragonfly Capital:
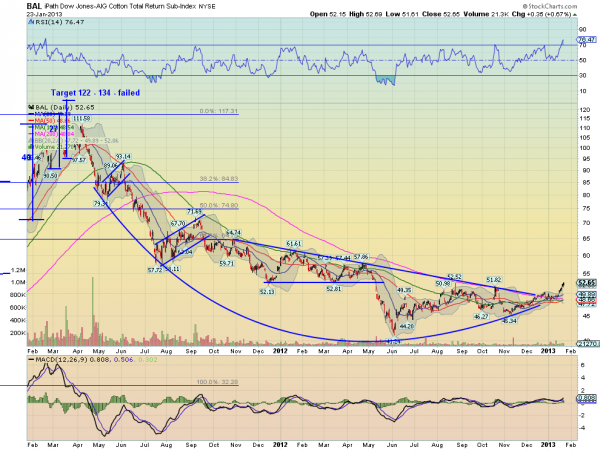
The commodity complex has moved lower since mid 2011 and there are many eyes on this space. Cotton ($BAL) is no exception. The chart below shows the rounded bottom and move higher accompanied by a break of the long downtrending resistance line. It is also moving higher over all of the tightly bunched Simple Moving Averages (SMA). All is well and time to jump on board for the next move higher right? Not quite so fast. There is one caution flag in this chart. The Relative Strength Index (RSI) has become technically overbought, over 70. You can see from the previous*Just today Agrimoney, who have been watching the action in cotton with a sharper eye than most, had a couple stories:
oversold signals (RSI under 30) that the stock [sic] can still continue in the current trend being overbought for a while, but it is hard to justify a new entry at this point....MORE
Cotton extends gains, despite doubts over rally
Cotton defies sell-off in softs to hit 7-month top
Recently:
Chinese Hoarding May Explain Cotton Market Mysteries
Cotton Market: Louis Dreyfus Says China is Manipulating the Market
Even More on the Chinese Cotton Market
