Yesterday's action, first the downdraft and then the rally in the last few minutes was noteworthy
First up All Star Charts:
Key Fibonacci Retracement Comes Into Play All Afternoon
Very interesting day today. We had a nice little market sell-off in equities as a lot of the triangles that we’ve been talking about broke to the downside, at least temporarily. I thought it was suspicious that we did NOT see the typical flight to safety trades that we normally have on a day like today. I get that options expiration is tomorrow and strange things seem to happen, but still. As we go through the “safety” list, there wasn’t a ton of action: The Dollar was flat to slightly up all day, Treasury Bonds had some bid, but not what we would expect, Gold got clobbered, and the Yen was up just a tiny bit. Typically we see big moves into some or all of these asset classes with the Dow down 200+.And from Afraid to Trade:
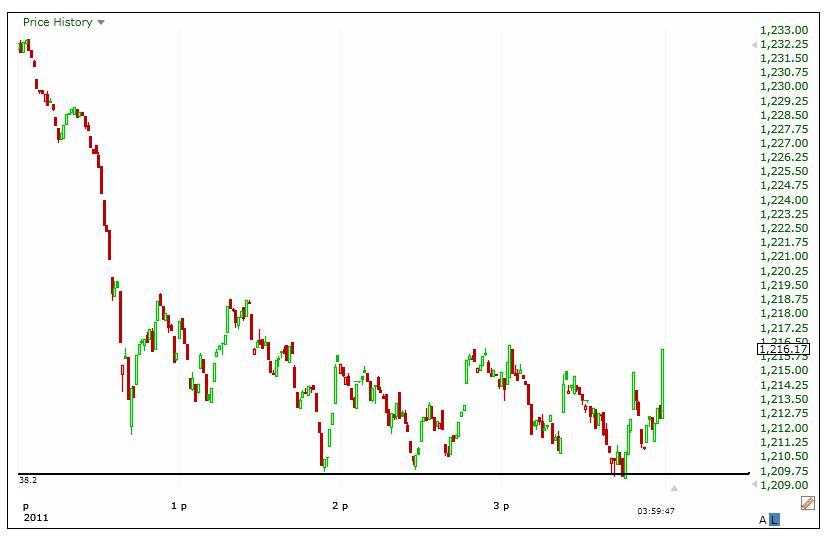
So how did equities behave today? I think the S&P500 tells the story. After breaking down below that lower trendline this morning, the S&P500 hung out around the 38.2% Fibonacci Retracement all afternoon. The first chart shows the bigger picture:
The second chart is an intraday look at the S&P500 showing the 38.2% Retracement in action all afternoon. You can’t make this stuff up guys:
When the S&P500 made that lower high last week, we immediately asked ourselves, “how low can we go?”. The first thing we did was look at the retracement levels. Today was the first one – 38.2% of the big October move. It’s amazing though how precise these levels can actually be. This chart above shows exactly how the Fibonacci retracement came into play after lunch....MORE
Quick Updating the Initial SP500 SPY Triangle Breakout
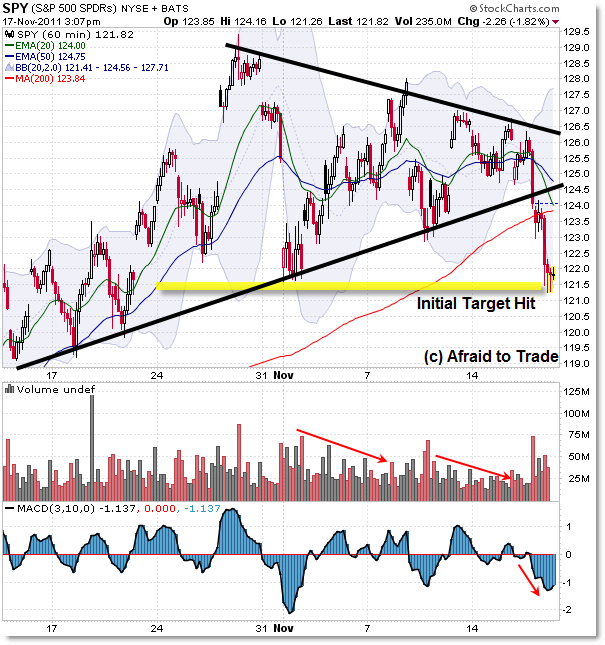
Let’s take a quick snapshot update of today’s breakdown from the Symmetrical Triangle Pattern we’ve all been watching in the S&P 500 (and SPY).
Today hit the initial downside target, but what’s the bigger picture saying?
Let’s start with the Hourly Breakout:
Take a look at our prior updates this week from the S&P 500 Symmetrical Triangle Pattern for pure-price charts ahead of the breakdown.
The initial downside target was the retest of the key 1,220 or $122 level which occurred on today’s sharp breakout/sell-off under the 1,240 ($124) critical support level.
What occurred was the expected move – that of a ‘feedback loop’ of liquidation from the bulls and short-selling from the bears that took price to the next lower “Decision Point” at $122.
That’s where we find price at the moment – challenging a critical “Make or Break” support level as buyers and sellers push for dominance (and we trade the resolution of the ‘battle’)....MORE


