From Wolf Street, September 11:
Second month-to-month acceleration in a row. Year-over-year, Core CPI and Core Services CPI show first acceleration since March.
On a month-to-month basis in a most unwelcome development, “core services” re-accelerated for the second month in a row in August, to 5.0% annualized, which fueled the re-acceleration of the overall Consumer Price Index (CPI) and Core CPI. Core Services make up about 65% of the Consumer Price Index and include housing, healthcare, and insurance.
On the positive side of the inflation ledger were durable goods (motor vehicles, furniture, electronics, etc.), where prices dropped even faster in August, and energy, where prices dropped across the board, while food prices remained roughly stable, according to the Bureau of Labor Statistics today.
On a month-to-month basis:
- Overall CPI: +0.19% (+2.3% annualized), 2nd acceleration in a row.
- Core CPI: +0.28% (+3.4% annualized), 2nd acceleration in a row.
- Core Services CPI: +0.41% (+5.0% annualized), 2nd acceleration.
- Durable goods CPI: -0.36% (-4.3% annualized), a faster drop.
- Food at home CPI: unchanged.
- Energy: -0.78%, after being unchanged in July.
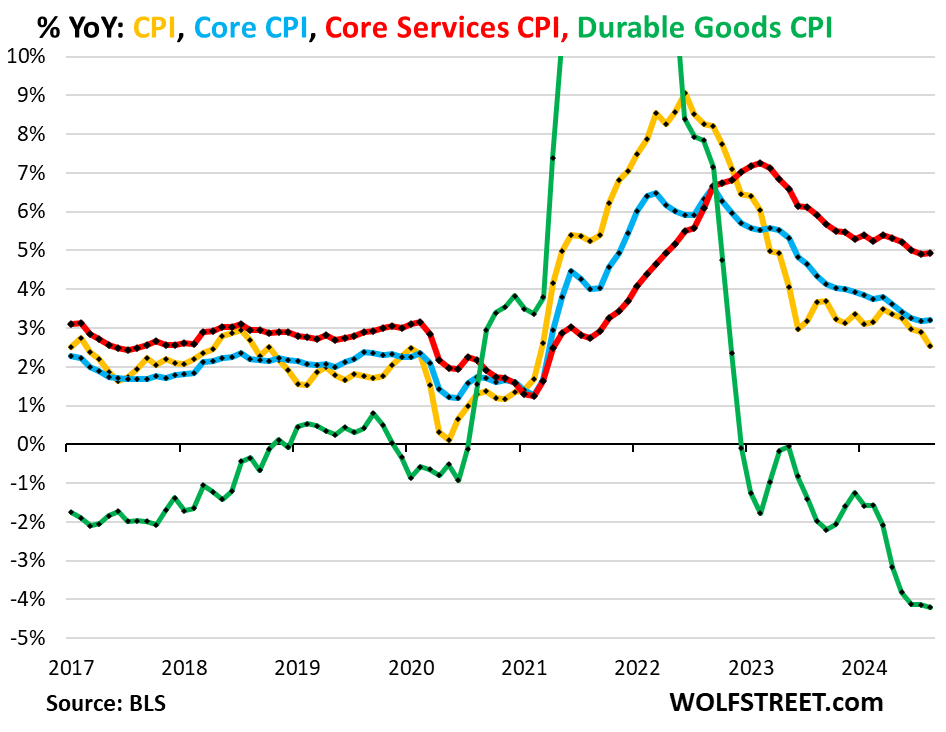
On a year-over-year basis, in summary:
Core services CPI (red in the chart below) rose by 4.93% year-over-year in August, a slight acceleration from July (4.90%). It has been near the 5% line since December 2023. It includes all services except energy services.
Durable goods CPI (green) has been falling since mid-2022 as it unwinds the historic spike during the pandemic. Used-vehicle prices have plunged. In August, durable goods CPI fell by 4.2% year-over-year, a downward acceleration from July, and the biggest year-over-year drop since 2003.
Core CPI (blue), which excludes food and energy, rose by 3.20% year-over-year, a slight acceleration from July (3.17%), with services pushing it into one direction, and durable goods into the other.
Overall CPI (yellow) rose by 2.5% year-over-year, a deceleration from July, on a drop in energy prices and stability in food prices.
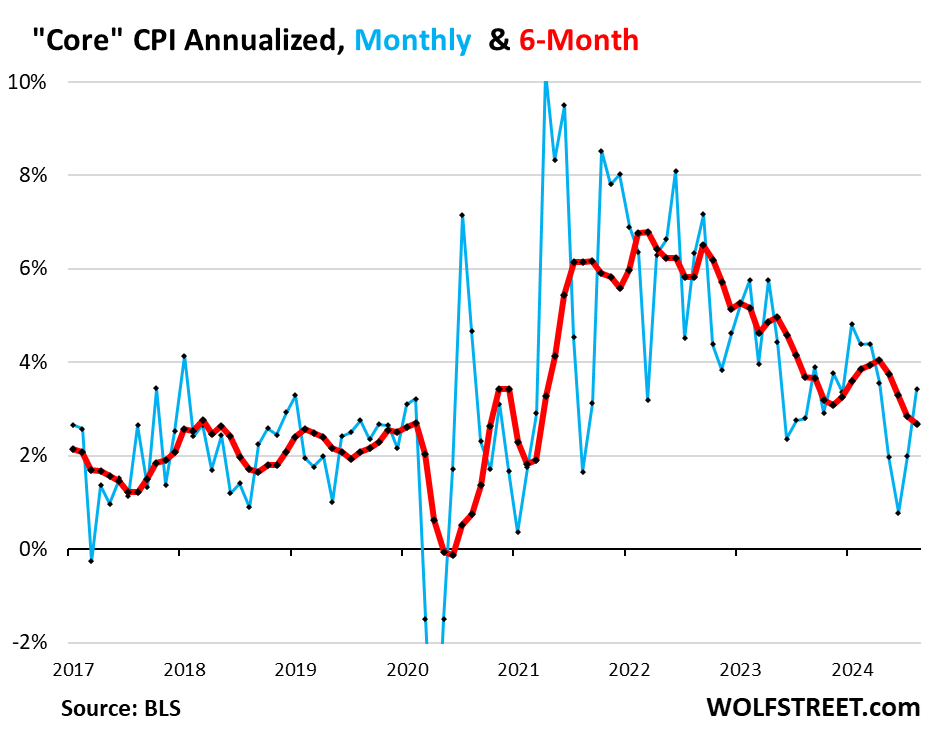
“Core” CPI, month-to-month.
Core CPI accelerated for the second month in a row, by 0.28% in August from July, or +3.4% annualized, the biggest increase since April (blue in the chart below).
The culprit for the re-acceleration was core services CPI, while the durable goods CPI continued to drop and pulled in the opposite direction.
The six-month core CPI, which irons out some of the month-to-month squiggles, rose by 2.7% annualized, as slight deceleration from July, as the high reading of February fell out of the six-month range.
“Core services” CPI bounced for the second month.
Core services CPI increased by 5.0% annualized in August from July (+0.41% not annualized), the second big bounce-back from the outlier in June and May (blue line)....
....MUCH MORE
He gets into the behavior of the housing component after the jump.
For what it's worth, the lag in Owner Equivalent Rent has for years been around 12 months. If folks now want to pick at OER they are going to have to assume an 18 month (or so) lag between the more frequent shelter numbers and the CPI, I'm doubtful these commenters will mention this, mainly because they didn't mention the lag as inflation was accelerating during 2021 and 2022.
On the other hand: "Credit Where Credit Is Due: One of the People Who Understood That Inflation Is More Than Just Gasoline Prices"