An article (not a paper) from the journal Nature, 23 June 2022:
Meteorologists are forecasting a third consecutive year of La Niña. Some researchers say similar conditions could become more common as the planet warms.
An ongoing La Niña event that has contributed to flooding in eastern Australia and exacerbated droughts in the United States and East Africa could persist into 2023, according to the latest forecasts. The occurrence of two consecutive La Niña winters in the Northern Hemisphere is common, but having three in a row is relatively rare. A ‘triple dip’ La Niña — lasting three years in a row — has happened only twice since 1950.
This particularly long La Niña is probably just a random blip in the climate, scientists say. But some researchers are warning that climate change could make La Niña-like conditions more likely in future. “We are stacking the odds higher for these triple events coming along,” says Matthew England, a physical oceanographer at the University of New South Wales in Sydney, Australia. England and others are now working to reconcile discrepancies between climate data and the output of major climate models — efforts that could clarify what is in store for the planet.
More La Niña events would increase the chance of flooding in southeast Asia, boost the risk of droughts and wildfires in the southwestern United States, and create a different pattern of hurricanes, cyclones and monsoons across the Pacific and Atlantic oceans, as well as give rise to other regional changes.
La Niña and its counterpart, El Niño, are phases of the El Niño–Southern Oscillation (ENSO) that occur every two to seven years, with neutral years in between. During El Niño events, the usual Pacific winds that blow east to west along the Equator weaken or reverse, causing warm water to gush into the eastern Pacific Ocean, increasing the amount of rain in the region. During La Niña, those winds strengthen, warm water shifts west and the eastern Pacific becomes cooler and drier.
The impacts are far reaching. “The tropical Pacific is huge. If you shift its rainfall, it has a ripple effect on the rest of the world,” says Michelle L’Heureux, a physical scientist at the National Oceanic and Atmospheric Administration (NOAA) Climate Prediction Centre in College Park, Maryland. During La Niña years, the ocean absorbs heat into its depths, so global air temperatures tend to be cooler.
Cold snapThe current La Niña started around September 2020 and has been mild-to-moderate most of the time since then. As of April 2022, it intensified, leading to a cold snap over the eastern equatorial Pacific Ocean not seen at that time of year since 1950. “That’s pretty impressive,” says England.The latest forecast from the World Meteorological Organization, issued on 10 June, gives a 50–60% chance of La Niña persisting until July or September. This will probably increase Atlantic hurricane activity, which buffets eastern North America until November, and decrease the Pacific hurricane season, which mainly affects Mexico. NOAA’s Climate Prediction Centre has forecast a 51% chance of La Niña in early 2023.
The weird thing about it, says L’Heureux, is that this prolonged La Niña, unlike previous triple dips, hasn’t come after a strong El Niño, which tends to build up a lot of ocean heat that takes a year or two to dissipate1. “I keep wondering, where’s the dynamics for this?” says L’Heureux.
Climate correlationThe big questions that remain are whether climate change is altering the ENSO, and whether La Niña conditions will become more common in future.Researchers have noticed a shift in the ENSO in recent decades: the latest report by the Intergovernmental Panel on Climate Change (IPCC) shows that strong El Niño and La Niña events have been more frequent and stronger since 1950 than they were in the centuries before that, but the panel couldn’t tell whether this was caused by natural variability or by climate change. Overall, the IPCC models indicate a shift to more El Niño-like states as climate change warms the oceans, says climate modeller Richard Seager at the Lamont–Doherty Earth Observatory of Columbia University in Palisades, New York. Puzzlingly, Seager says, observations have shown the opposite over the past half-century: as the climate has warmed, a tongue of upwelling waters in the eastern equatorial Pacific Ocean has stayed cold, creating more La Niña-like conditions2....
....MUCH MORE
Perhaps just as important are the current states of two longer-term cycles, the Pacific Decadal Oscillation and the Atlantic Multidecadal Oscillation. The PDO has been in a negative phase since early 2018 whereas the AMO has been in a positive phase for most of the last decade (actually 40-some years if you exclude some months).
This combination has been observed to bring exceptional drought to the U.S. Southwest and California i.e. the map at bottom right, an area already drier than the rest of the country:

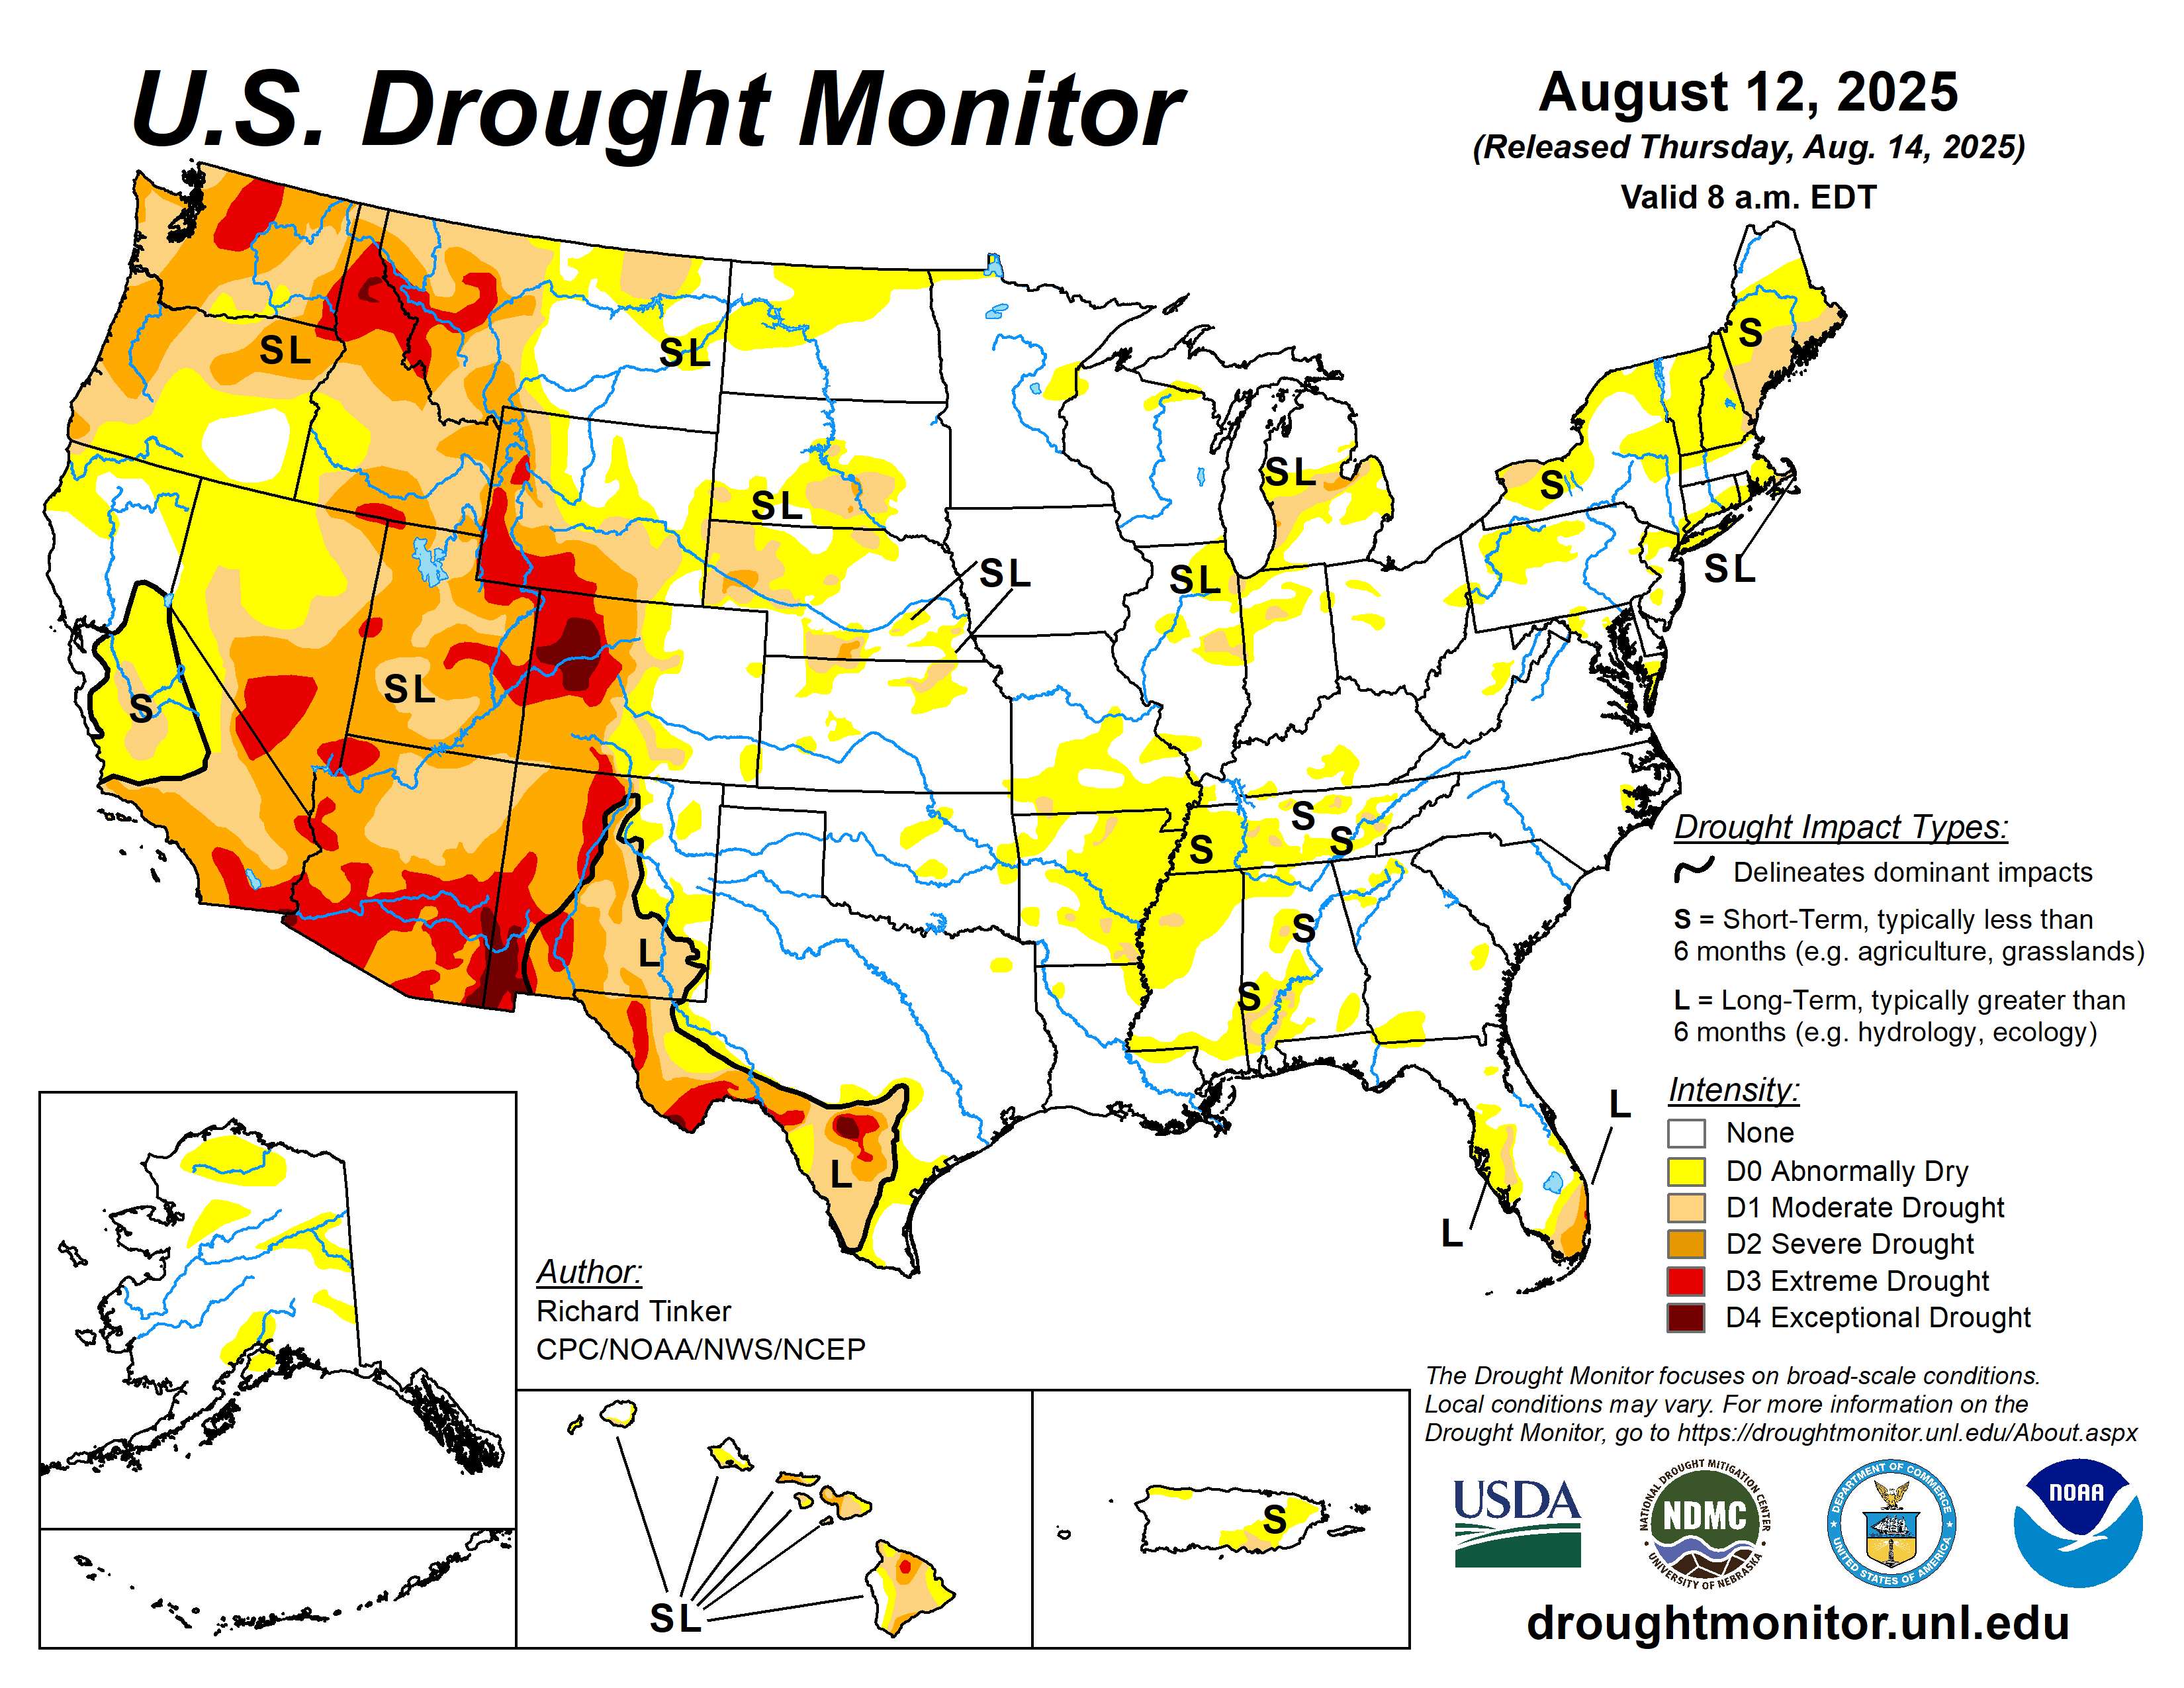
For comparison, here is the most recent Drought Monitor map from the University of Nebraska - Lincoln:
Credit for the forecast maps must go to:
McCabe G J et al. PNAS 2004;101:4136-4141From McCabe (2004):
More than half (52%) of the space and time variance in multidecadal drought frequency over the conterminous United States is attributable to the Pacific Decadal Oscillation (PDO) and the Atlantic Multidecadal Oscillation (AMO). An additional 22% of the variance in drought frequency is related to a complex spatial pattern of positive and negative trends in drought occurrence possibly related to increasing Northern Hemisphere temperatures or some other unidirectional climate trend. Recent droughts with broad impacts over the conterminous U.S. (1996, 1999-2002) were associated with North Atlantic warming (positive AMO) and northeastern and tropical Pacific cooling (negative PDO). Much of the long-term predictability of drought frequency may reside in the multidecadal behavior of the North Atlantic Ocean. Should the current positive AMO (warm North Atlantic) conditions persist into the upcoming decade, we suggest two possible drought scenarios that resemble the continental-scale patterns of the 1930s (positive PDO) and 1950s (negative PDO) drought.
Where this gets really interesting is if the PDO also goes positive, something it has been hinting at doing the last few months. Should that happen we would be dealing with the situation depicted in the second of the +/- maps, with the drought moving north from Texas, Nevada and California into the heart of the American grain belt.