April 7
We have entered into a very unusual period in markets where the rules have changed. Earnings and official economic data don’t matter. If a firm reports bad results this quarter, it hardly tells you anything about the business. Each quarter a company reports has a small impact on its intrinsic value, but a large impact on future expectations, so stocks move sharply on small changes to results.
There’s a certain aspect of post-earnings movements in stocks related to algorithmic trading and people making bets without deciphering what the numbers and comments mean. However, each quarter gives us the best look at the potential for the business. This quarter most firms will do poorly, but that tells us virtually nothing about the long term prospects of the business. The only thing that matters is if the company has a strong balance sheet or financing options available to keep it in business long enough to see the recovery.....MUCH MORE
That perspective on earnings is an opinion based on how we’ve seen stocks react to economic reports. We’ve seen stocks ignore two record jobless claims reports in a row because economic reports have little impact on what matters. Usually economic reports help you determine when a recovery is coming, but now what tells us if a recovery is coming is the number of new COVID-19 cases. As the number of new cases starts to fall, investors will look towards government to see when the economy will reopen. If you wait for the economy to improve, you will miss the move in markets because they forecast the future.
Stocks Lead Jobless Claims
The chart below shows stocks bottom about a month before initial jobless claims top....
And:
April 6
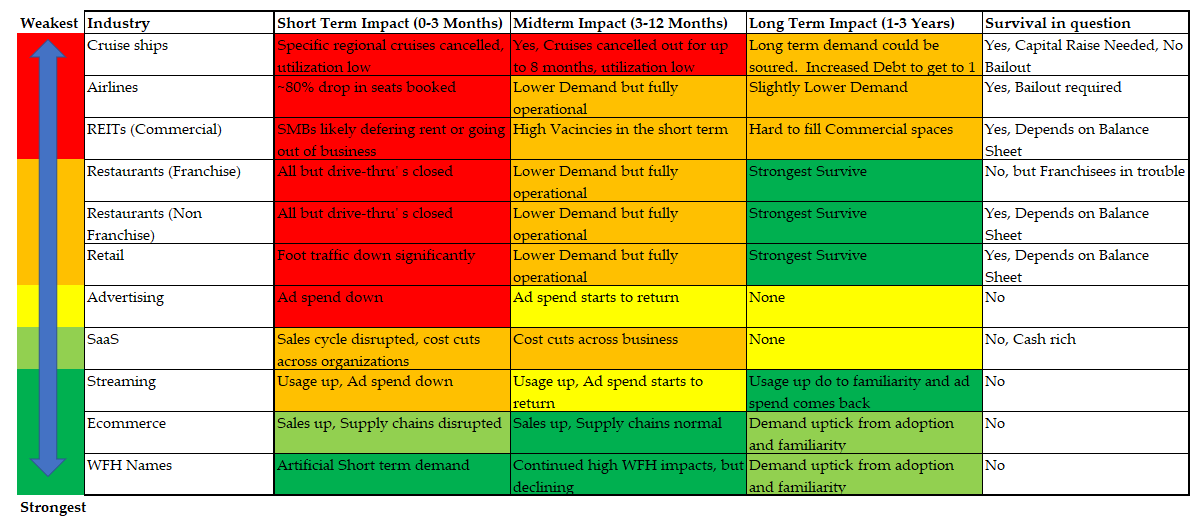
Industry Performance Before & After Recessions
The March labor market report was a disaster even though the numbers were only updated from the week of March 12th. Stocks sold off modestly in response to this terrible report on Friday as the bear market has priced this weakness in. Stocks don’t fall on bad news because the base case scenario is the economy bottoms in April or May and recovers throughout the year. Contrary to popular wisdom, economists are not predicting a V-shaped recovery. 1/3rd see a V-shaped. A U-shaped is the more popular position.
We are studying the labor report to see how big of a hole the economy is going to need to dig out of. Noted short seller Jim Chanos mentioned investors would throw 2020 numbers out, but remember that 2021 is going to start where this year leaves off. Plus, we don’t know how long the virus will impact the economy; some firms will be forced to close, meaning they won’t participate in the recovery.
Establishment Versus Household
The establishment survey showed there were 701,000 jobs lost which missed estimates for 150,000 jobs lost. The unemployment rate spiked to 4.4% from 3.5%. That was the biggest monthly increase since January 1975. The record long streak of job creation that started in October 2010 ended. Leisure and hospitality lost 459,000 jobs and information added 2,000. This shift caused the average hourly wage growth to increase 0.1% to 3.1% which was a rare good number in a sea of disaster.
The household survey was even worse than the establishment survey as it showed there were 2.987 million less employed people than last month as you can see from the chart below. That was by far the biggest decline in employed people in a month ever. The previous worst was 1.217 million in January 2009. Both surveys cover the same time period. The household survey covers 60,000 households and businesses including agricultural workers. The establishment survey is a non-farm survey of 145,000 households and businesses. The household survey may have been more accurate this month as the establishment survey had a lower than normal response rate....
******

....MUCH MORE
And:
April 3
9.5% Unemployment Rate Is Here Already