|
This rally has been great, lifting portfolios around the world. With lots of optimism helping the market here, there are some worldwide charts that I reviewed on the Weekly Market Roundup show. There is a link to the video further down in this article.
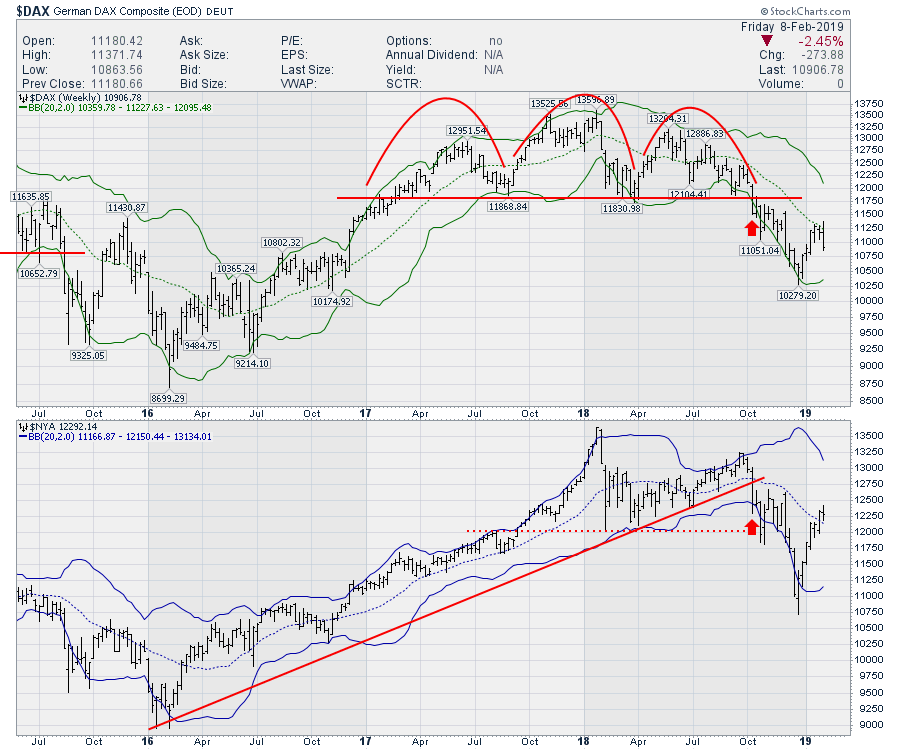
Back in October (see the red arrows on the chart below), I mentioned that the German stock market was breaking down in a pattern that we have seen before. This breakdown coincided with USA charts breaking down in October 2018, with the first bar breaking below support on the $DAX and the US market breaking the trend line. Here is a link to the article in question: Zooming Out - Is A Major Market Top In? October 15th, 2018.
In the article, I discussed how global markets were very weak and that the breakdown in Germany, coinciding with the break in the US market trend line, has happened before. This coincidental breakdown was excellent global timing for standing aside. The charts posted in the article were from the first week that the $DAX broke its support line. Now, the $DAX has returned to the 20-week moving average, shown on the chart as a dotted green line. The USA NYSE Composite (all of the stocks on the New York Stock Exchange) is marginally above the 20-week moving average. Currently, the $DAX is making a 3-week low, which could be the start of a rollover. So is this helpful or irrelevant?
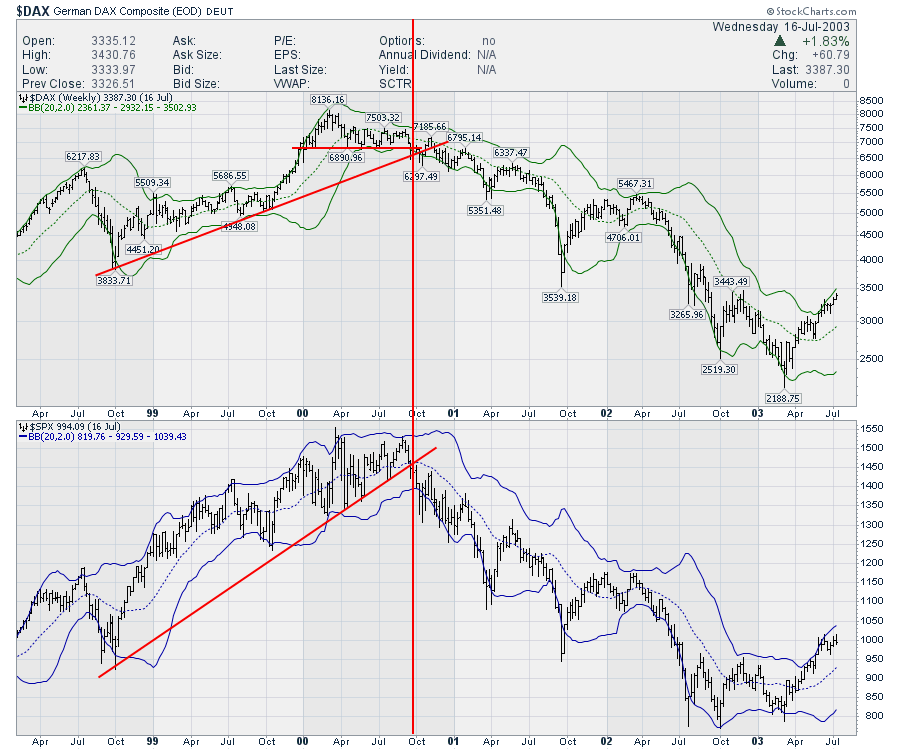
Well, if we look back at previous market tops like in 2000-2003, both stalled around the 20-week moving average. The first 3-week low was not bad timing in October 2000.
In 2007-2009, they spent a few weeks above the 20-week moving average....
a Palais des Beaux-Arts de Lille set-up but they are very rare.
