This article was published in the RRG blog on 31 January and takes a look at the Bloomberg Commodity Index Groups through the lens of a Relative Rotation Graph.
When possible, I prefer to use data-sets that come from the same family and creating a "closed universe." This is a universe where all securities on the RRG together make up the benchmark that is used for comparison.
For the US sectors, we often use the 11 SPDR ETFs and compare them against SPY. All these ETFs together make up SPY.
For commodities, we can achieve a similar setup by using the Bloomberg commodity index family.
Bloomberg Commodity Index Family
The Bloomberg Commodity Indexes are a family of financial benchmarks designed to provide liquid and diversified exposure to physical commodities via futures contracts.
You can read up on this index family on the Bloomberg website. That page will also provide you with plenty of resources and information to understand how these indexes are constructed and maintained.
One document which I want to highlight, can be downloaded from that website (just click on the image below), is the overview of the 2019 BCOM Target Weights.
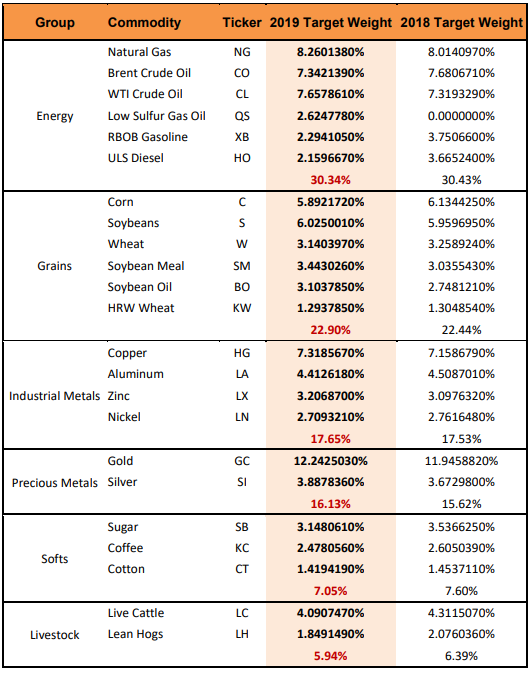
This
overview shows the breakdown of the overall Bloomberg Commodity Index
($BCOM) into six groups. Each of these groups contains a number of
individual commodity contracts.
You can compare the groups with the sectors in the stock market, and the individual commodities are the individual stocks.
The table below shows the ticker symbols in the Stockcharts database that are connected to these commodity groups.
Putting This Index Family On A Relative Rotation Graph
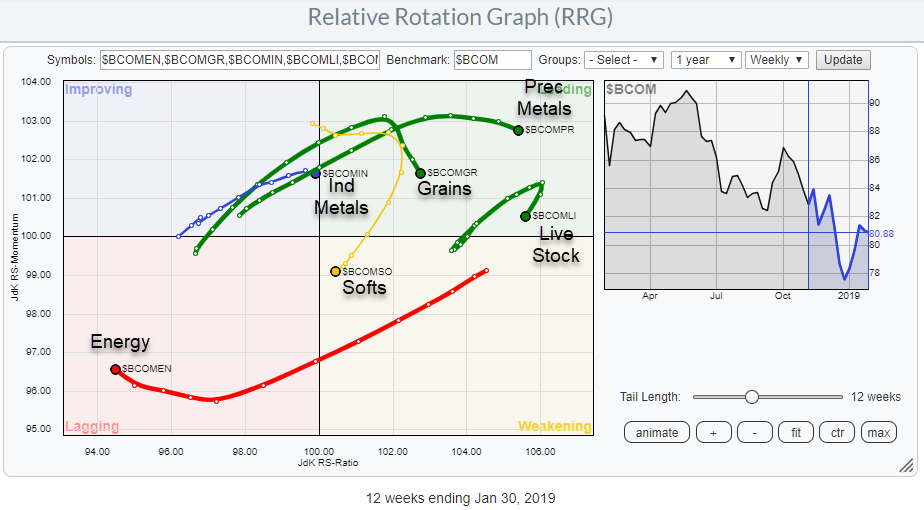 Putting these six groups on a Relative Rotation Graph and setting $BCOM as the benchmark gives the picture above.
To make things easy for you we have added this universe to the pre-defined groups on the RRG page. Just open the Groups drop-down selection and scroll down to the commodities section. The group in the RRG above is the first one in there, called Bloomberg Commodity Sub-indexes.
As you can see, here also, the rotational behavior of these groups around the center (benchmark) of the RRG shows up.
The first quick takeaway from this RRG is that Energy, which is the biggest group at 30% weight, is dragging the general commodity index down. This causes the other groups to cluster diagonally from the Energy group in order to keep the universe balanced around its benchmark.On the opposite side, inside the leading quadrant, we find Precious metals still heading higher on the Jdk RS-Ratio scale but losing some relative momentum. The Industrial metals are about to enter the leading quadrant which may offer a good opportunity while we need to keep an eye on Softs as they are inside the weakening quadrant and rotating towards lagging.
Bloomberg Energy Subindex - $BCOMEN
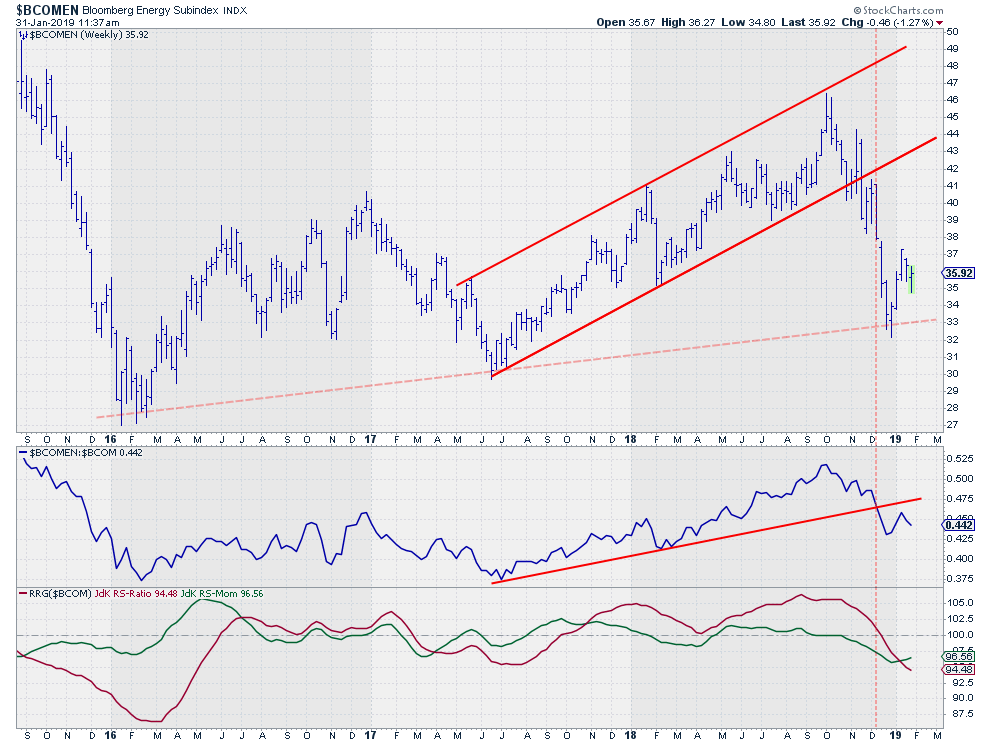
...MOREThe uptrend in the energy group helped $BCOM going higher from mid-2017 to mid-2018 but was not strong enough to keep things up much longer when $BCOM peaked in May. The Energy group was able to continue on its own for a little while until October....