El Niño "conditions" begin at a half-degree above the zero line while a full blown El Niño is declared after three rolling three month periods (five consecutive months) above +0.5°C.Besides all its other effects, during the hurricane season El Niño tends to produce wind shear in the North Atlantic which in turn tends to inhibit development of hurricanes which tends to reduce the number of storms and to a lesser extent their severity. It's not a lock but is the direction to shade the bet.
From one our big three sources for forecasts, Columbia/IRI the most recent update:
IRI ENSO Forecast
2019 April Quick Look
Published: April 19, 2019
A monthly summary of the status of El Niño, La Niña, and the Southern Oscillation, or ENSO, based on the NINO3.4 index (120-170W, 5S-5N)With the Statistical peak of hurricane season being September 10, we pay particular attention to the plume of model runs for the August/September/October period:
Use the navigation menu on the right to navigate to the different forecast sections
SSTs in the tropical Pacific maintained a weak El Niño level during March and early April, while temperature anomalies of subsurface waters decreased somewhat but continued to be positive. Patterns in the atmosphere show weak El Niño conditions. Collective model forecasts show a continuation of at least weak El Niño-level SSTs lasting through 2019. The somewhat more cautious official CPC/IRI outlook, with an El Niño advisory, calls for an approximate 65% chance of El Niño prevailing during Jun-Aug, decreasing to 50-55% for Sep-Nov....MORE
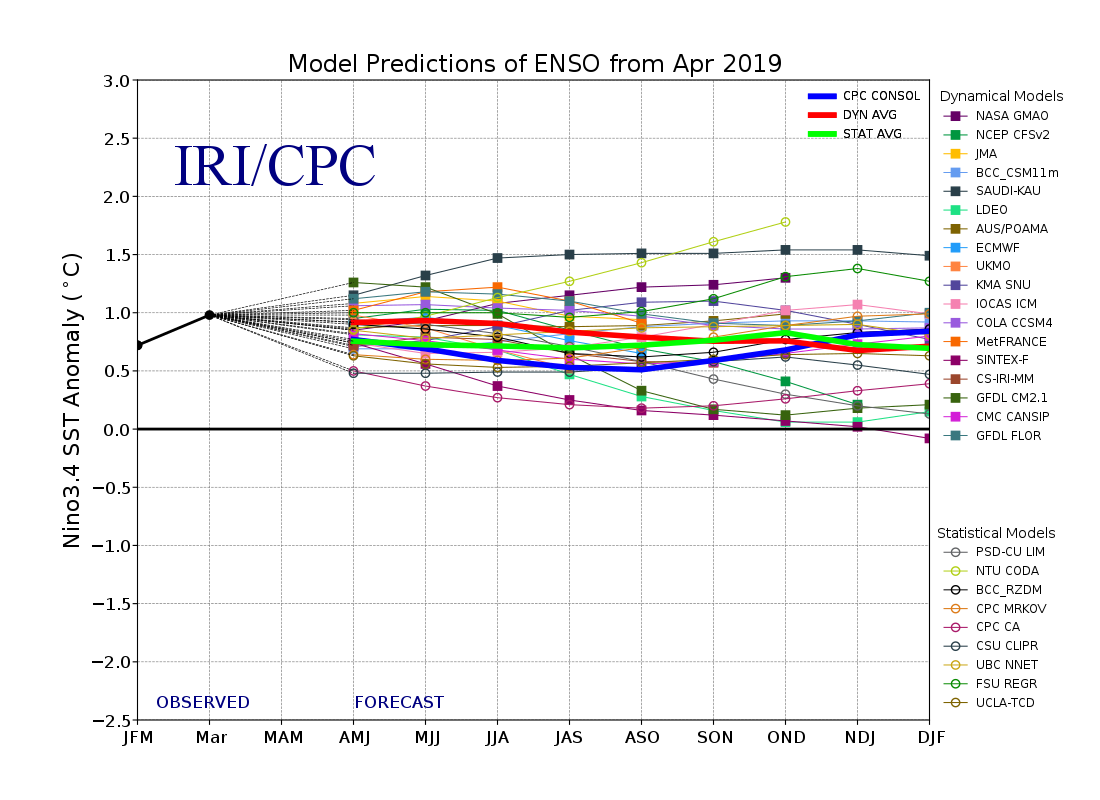
IRI/CPC ENSO Predictions Plume
Published: April 19, 2019
Note on interpreting model forecasts
The following graph and table show forecasts made by dynamical and statistical models for SST in the Nino 3.4 region for nine overlapping 3-month periods. Note that the expected skills of the models, based on historical performance, are not equal to one another. The skills also generally decrease as the lead time increases. Thirdly, forecasts made at some times of the year generally have higher skill than forecasts made at other times of the year--namely, they are better when made between June and December than when they are made between February and May. Differences among the forecasts of the models reflect both differences in model design, and actual uncertainty in the forecast of the possible future SST scenario.