The 2940.91 all-time high from last September is tantalizingly close.
From StockCharts, April 17:
Are We Looking At A Wedge In The Making?
When acting in an environment of uncertainty (of which financial markets are a prime example) it is a good habit to double-check any findings. Think of it as an extra pair of eyes to confirm or deny what you (think you) are seeing....
***
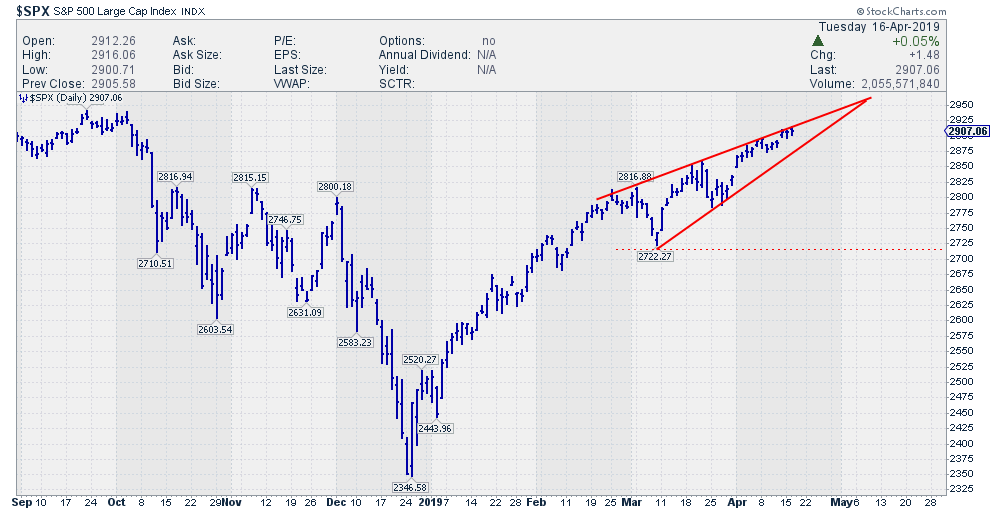
...Over the past few days, it looked to me as though a rising wedge has been building up in the chart of $SPX. To double check if I was the only one seeing this, I searched Twitter for "$SPX wedge." I quickly found out I was not alone - over the past few days, a ton of people have been tweeting about this wedge in the S&P 500 index....MORE
In the chart above, I have annotated the wedge on the daily chart and am seeing that is becoming better defined almost by the day. This is especially true of the upper boundary, which has a lot of touch points that make it a reliable resistance level. The lower boundary is connecting only two lows, but I'd like to accept it as support in combination with the upper boundary of the wedge formation.
Rising wedges at the end of a trend are topping formations and have a negative implication - but only when they are broken downward!That has not happened yet.
How About The Hourly Chart?