From Wolf Street, February 19:
Something has to give.
Starting to be a fascinating phenomenon: Rates charged by trucking
companies and other transportation providers continue to surge on a
year-over-year basis even as the volume of shipments has dropped below
where it had been a year ago, while the “capacity squeeze” of 2018 has
disappeared, and as the price of fuel is down year-over-year.
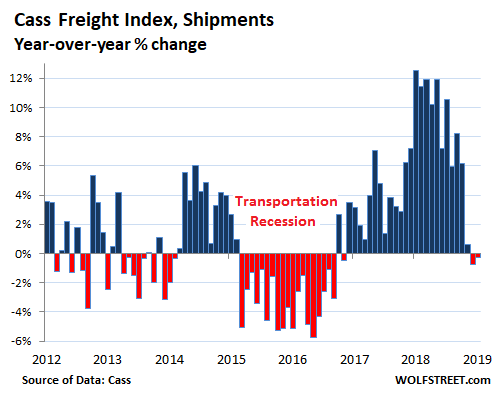
Freight shipment volume across all modes of transportation – truck,
rail, air, and barge – in January ticked down (-0.3%) from January last
year, according to the Cass Freight Index,
the second year-over-year decline in a row. Those two declines are the
first since the transportation recession of 2015 and 2016. The
extraordinary plunge since the extraordinary peak in shipments last
summer indicates that the transportation boom with its double-digit
year-over-year increases has fizzled. This chart shows how freight
volume changed from the same month a year earlier:
The Cass Freight Index covers shipments of merchandise for the
consumer and industrial economy via all modes of transportation, but it
does not include bulk commodities, such as grains or chemicals.
The year-over-year comparison in the chart above – for example,
comparing January 2019 to January 2018 – eliminates the noise caused by
the hefty seasonal fluctuations of the transportation business that
occur every year.
But the chart also delineates the notorious cyclicality of the
transportation business, where some big up-years are followed by
down-years, such as the drop in shipments during the “transportation
recession” of 2015 and 2016, when the goods-based sector of the economy
itself went into a recession, and only the strength of the service
economy kept GDP growth positive (at a miserably low 1.6% in 2016). The
transportation recession was followed by a historic surge in shipments
from late 2017 through the first half of 2018, causing a capacity
squeeze that triggered a lot of hand-wringing among shippers, such as
retailers and industrial companies. That boom and capacity squeeze have
now been unwound.
This capacity squeeze in the trucking industry, and the subsequent
resolution of it, shows up in the DAT Load-to-Truck ratio which tracks
the demand-capacity balance. This ratio for “vans” – the trailers that
Class-8 trucks haul across the US – surged twice in 2018: First, the
spike in January 2018, when use of Electronic Logging Devices (ELDs)
became the law, which caused a temporary squeeze as truckers had to
rejigger their operations; and then, the flood of demand in the summer
blew the ratio out again. But the demand-capacity balance is now
reverting to the mean:...MUCH MORE