So instead we've been focusing on second and third derivative stuff like freight rates or shipping company stocks when what the world is craving is highly leveraged (accurate) directional bets.
Or something.
Look at this:

The amount of natural gas in storage is not only lower than the 5-year average, it's been setting new five-year, year-on-year, lows. You would think the futures would be at least $5.00. Instead:
They can't seem to get much above $3.25.
There is a lot of gas around, in the U.S., unconventional (shale) supplies have gone from 5% to 40% of total production in just over a decade, the last of the Australian mega-projects just started delivering this week and Russia's Yamal gas is ramping up fast but still....$3.25?
Here's one more piece of the puzzle from the National Oceanic and Atmospheric Administration Climate Prediction Center interpreted by the ENSO blog:
October 22, 2018
The air is starting to feel crisp, the leaves are changing, and the aroma of pumpkin spice lattes are filling your favorite coffee shops. This can only mean one thing – it’s time for my annual post on NOAA’s expectations for the upcoming winter! And once again, one of the key players is found in the tropical Pacific. In contrast with the last two years, when we were looking at potential La Niña development, this year we’re waiting to see if El Niño will arrive in time to impact winter. Without further ado, let’s take a look at NOAA’s 2018-19 Winter Temperature and Precipitation Outlook and see how ENSO has affected this forecast.
As usual: Outlooks are probabilistic, so no guarantees
Wait, just one more thing before jumping to the outlooks. I again remind readers (if this seems repetitive, well, it is) that these forecasts are provided in terms of probabilities (% chance) for below, near, or above average outcomes with the maps showing only the most likely outcome (1). Because the probabilities on these and all CPC outlook maps are less than 100%, there is no guarantee you will see temperature or precipitation departures from normal that match the color on the map. As we’ve explained in earlier blog posts, even when one outcome is more likely than another, there is still always a chance that a less favored outcome will occur. And in fact, for the forecasts to be reliable (a critical part of a probabilistic forecast), less likely outcomes MUST happen from time to time.
Outlook for 2018/19 winter
Finally, the outlooks! Both the temperature and precipitation outlooks depend to a certain extent on typical El Niño impacts, but forecasters think a weak El Niño event is most likely. This means that despite the potential for El Niño, confidence in this outlook is less than we had than during recent strong events like in the winter of 2015/16 (more on confidence below).
This lower confidence is reflected in fairly modest probabilities for the temperature outlook, with the largest probabilities only between 50-60% for above normal temperatures in Hawaii, Alaska, and parts of the Pacific Northwest and northern Rockies. The other shaded regions on the map indicate probabilities between 33-50%, meaning that the forecast only tilts modestly towards above normal temperatures. And while no areas of the country are favored to have below normal temperatures, it certainly wouldn’t be surprising for some areas to experience below normal temperatures this winter. This would be most likely in the white areas labeled EC (more on that later).
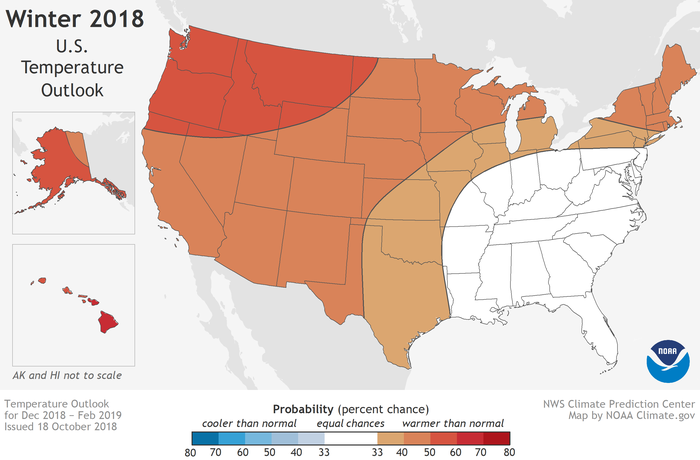
Places where the forecast odds favor a much colder than usual winter (blue colors) or much warmer than usual winter (red), or where the probability of a cold winter, a warm winter, or a near-normal winter are all equal (white). The darker the color, the stronger the chance of that outcome (not the bigger the departure from average). NOAA Climate.gov map, based on data from NOAA CPC.
Similarly, the precipitation outlook is also much less confident (lower probabilities) than the forecast for the last El Niño winter. The pattern does resemble the typical precipitation pattern seen in an average El Niño, with above-average precipitation favored over much of the southern tier and southern Alaska, and with below-average precipitation most likely in the northern Rockies, around the Great Lakes and in Hawaii. However, the probabilities are much lower than typical for an El Niño winter, reflecting greater uncertainty over what may happen. A 50% chance is exceeded only in northern Florida and southern Georgia, and in Hawaii.
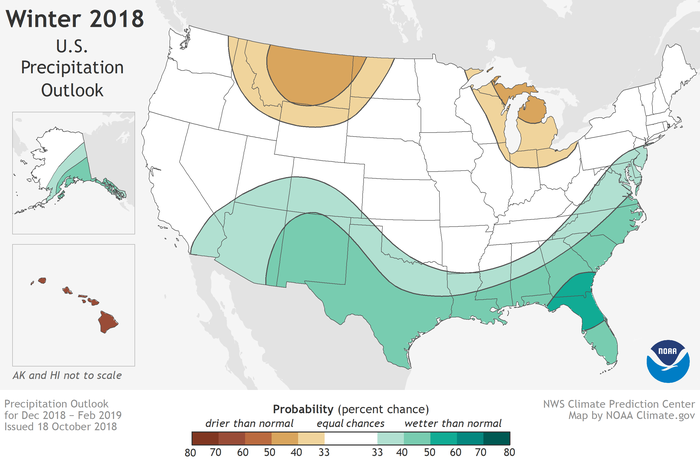
Places where the forecast odds favor a much drier than usual winter (brown colors) or much wetter than usual winter (blue-green), or where the probability of a dry winter, a wet winter, or a near-normal winter are all equal (white). The darker the color, the stronger the chance of that outcome (not the bigger the departure from average). NOAA Climate.gov map, based on data from NOAA CPC.
Both maps include blank regions where neither above-, nor near-, nor below-normal is favored. These areas (shown in white and labeled EC for “equal chances”), have the same chance for above-, near-, or below-normal (33.33%). This doesn’t mean that near-average temperature or precipitation is expected this winter in those regions, but rather that there’s no tilt in the odds toward any outcome. And as mentioned earlier, the blank region in the temperature map has the greatest chance of being colder than average this winter....MUCH MORE
El Niño: Where’s the confidence?
In two of my earliest posts for the ENSO Blog, I wrote about the relationship between El Niño and winter precipitation and temperature, presenting figures showing precipitation and temperature differences from average for the 20 prior El Niño episodes from 1950-2013. Here those figures are updated below to include events through the 2015/16 El Niño. An important theme emerges from these two figures: in terms of U.S. impacts, no two El Niño episodes are the same, and winter precipitation and temperature become less consistent as the strength of El Niño decreases....
NOAA used to end their press releases with:
NOAA understands and predicts changes in the Earth's environment, from the depths of the ocean to the surface of the sun, and conserves and manages our coastal and marine resources.That was throttled back in 2011:
NOAA’s mission is to understand and predict changes in the Earth's environment, from the depths of the ocean to the surface of the sun, and to conserve and manage our coastal and marine resources. Join us on Facebook , Twitter and our other social media channels.