Revisiting the 2007 S&P 500 Reversal
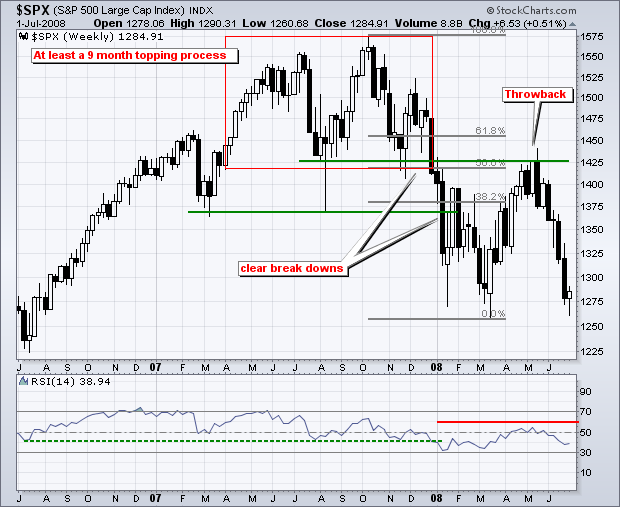
Although no two market tops are the same, we can get an idea of what a major reversal looks like by examining past reversals. The 2007 top evolved over a 9 month period. There were clear support breaks at 1425 and 1375. RSI broke its bull zone (40 to 80) at the end of December 2007. The ensuing throwback rally retraced 50% and met resistance near broken support.

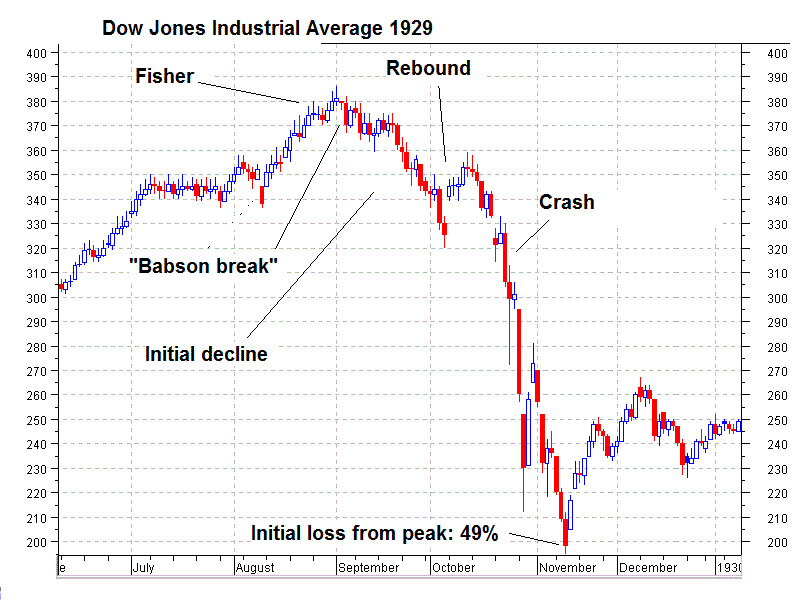
Here's another example via SNBCHF, the Dow Jones Industrial in 1929:

Do note this chart only takes you to the first week of 1930. The DJIA didn't bottom until July 8, 1932.
At 41.22 (close, 40.56 intraday)
The failure to re-take the highs after the first decline (the right shoulder of an H&S patter) is your clue to be wary.
Keep in mind that in broad based indices you have all kinds of churning around going on, some stocks head down while the index is still rising etc.
Possibly more interesting is this account of ubbly-bubbly parabolic goodness, from Feb. 2012:
Prop Trading the South Sea Bubble: Hoare's Bank 1720
I've mentioned the archives at Hoare's bank a few times, firstly, I believe, in "South Sea Bubble Survivor Says Dismantle RBS Along With Lloyds":
*From deep in the link-vault comes a tiny treasure, an analysis of Hoare's trading during the South Sea bubble (15 page PDF):
Riding the South Sea Bubble
By PETER TEMIN AND HANS-JOACHIM VOTH
By PETER TEMIN AND HANS-JOACHIM VOTH
This paper presents a case study of a well-informed investor in the South Sea bubble. We argue that Hoare’s Bank, a fledgling West End London bank, knew that a bubble was in progress and nonetheless invested in the stock: it was profitable to “ride the bubble.” Using a unique dataset on daily trades, we show that this sophisticated investor was not constrained by such institutional factors as restrictions on short sales or agency problems....MOREThe bank has opened their records to academics and Temin and Voth have taken full advantage.
Along with the above they published "Banking as an emerging technology: Hoare’s Bank, 1702–1742" in Financial History Review and "Private borrowing during the financialrevolution: Hoare’s Bank and its customers, 1702–24" in Economic History Review.
It's Riding the South Sea Bubble that really stands out though and is the 'tiny treasure'.
Yesterday, as I was putting "The World's First Stock Exchange (and first bear raid, first dividend, first equity derivatives...)" together I wanted to refer to RtSSB and did a quick search of the blog.
The link was broken.
The entire original purpose of this blog was to give me a database of things that caught my interest during the trading day. Hosted on Google's servers. Searchable by the Goog's algos (or anyone else).
And the damn link was broken. So I had to replace it.
And I re-read the whole 15 page paper, starting with:
What allows asset price bubbles to inflate? The recent rise and fall of technology stocks have led many to argue that wide swings in asset prices are largely driven by herd behavior among investors. Robert J. Shiller (2000) emphasized that “irrational exuberance” raised stock prices above their fundamental values in the 1990s. Others, however, have pointed to structural features of the stock market, such as lock-up provisions for IPOs, analysts’ advice, strategic interactions between investors, and the uncertainties surrounding Internet technology, as causes of the recent bubble. We use a historical example to ask which of these explanations is most apt, with the potential to shed light on other important episodes of market overvaluation.And I thought "sweet".
We examine one of the most famous and dramatic episodes in the history of speculation, the South Sea bubble. Data on the daily trading behavior of a goldsmith bank—Hoare’s—allow us to examine competing explanations for how bubbles can inflate.
While many investors, including Isaac Newton, lost substantially in 1720, Hoare’s made a profit of over £28,000, a great deal of money at a time when £200 was a comfortable annual income for a middle-class family (John Carswell, 1993). The behavior of a single knowledgeable investor can tell us much about the nature of bubbles and investors during periods of substantial mispricing. The bank did not profit simply by chance. It “rode the bubble” for an extended period while giving numerous indications that it believed the stock to be overvalued. Short-selling constraints and the difficulties of arbitrage that have been emphasized in recent work on the dot-com mania cannot explain the South Sea bubble. A zero-investment constraint, if it existed, did not bind market participants like Hoare’s. Perverse incentive effects arising from delegated investment management highlighted in recent work on mutual funds and hedge funds were not at work. We infer that the need for coordination in attacking the South Sea bubble was the key to allowing it to inflate to such an extreme extent, in line with recent theoretical work by Dilip Abreu and Markus Brunnermeier (2003).
There is a rich body of earlier research on the emergence of bubbles. The efficient markets hypothesis rules out substantial mispricing (Eugene F. Fama, 1965). The same conclusion emerges from no-trade theorems under asymmetric information, as well as from backward induction in finite horizon models (Manuel Santos and Michael Woodford, 1997; Jean Tirole, 1982). Famous historical episodes like the South Sea bubble, the tulip mania, and the Mississippi speculation are given as examples of markets functioning reasonably well under uncertainty (Peter M. Garber, 2000). Recent theoretical and empirical work, however, suggests that bubbles can inflate even if there are large numbers of highly capitalized, rational investors....
The two most important parts of the paper "II. Hoare’s Trading Performance" and "III. Causes of Success" are definitely worth a couple minutes. Here's
*****
Now that link is dead, the mortality rate for links is probably itself graphable as a parabola.Here's the copy hosted at MIT, cross your fingers that the famous trade school on the Charles can stay open for a while longer.