Choose your own adventure, China contagion edition
An update from Alberto Gallo’s chart-chest:
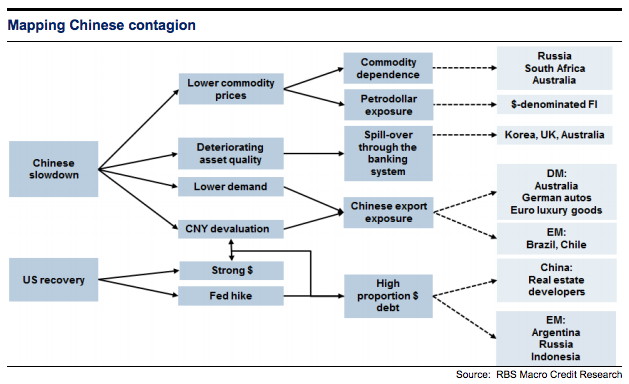
We would suggest this is the correct way of thinking about China. The true level of GDP growth is gonna always be an especially fuzzy metric so it’s the right hand side of that chart — the effects of the slowdown — which matter and allow you to track backwards....MUCH MORE
Long form, that looks like this:
1. Commodity dependence hurts. Growth in China has a strong impact on commodity prices: it consumes nearly half of the global supply of industrial metals given its past investment led-growth model. A slowdown in China therefore leaves commodity dependent LATAM economies and Australia vulnerable.
2. Petrodollars become petropennies: With lower oil prices, the annual flow of petrodollars may have halved to around $200-300bn, by our estimates. This may reduce the demand for fixed income assets, which was a significant portion of major oil exporting sovereign wealth funds’ growing investments over the past decade....