"Commodity prices and exchange rates"
From Econbrowser:
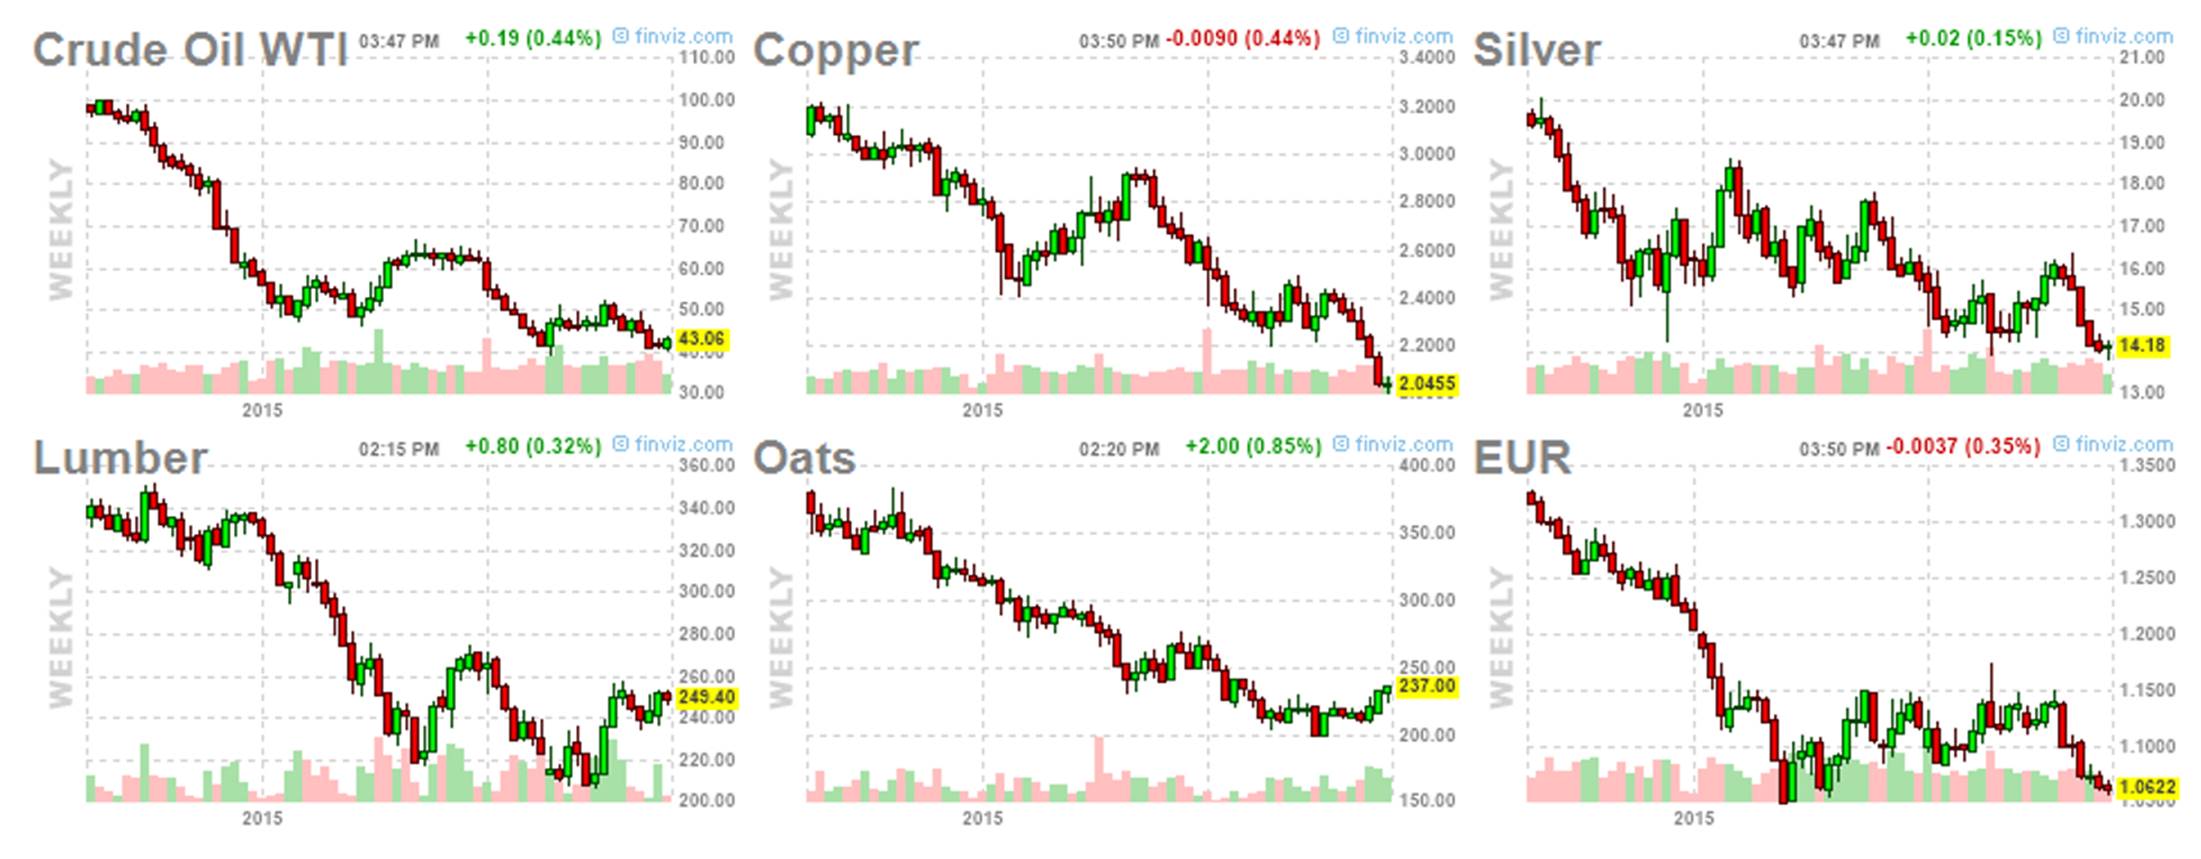
The dramatic decline in the prices of a number of commodities over
the last 16 months must have a common factor. One variable that seems to
be quite important is the exchange rate.
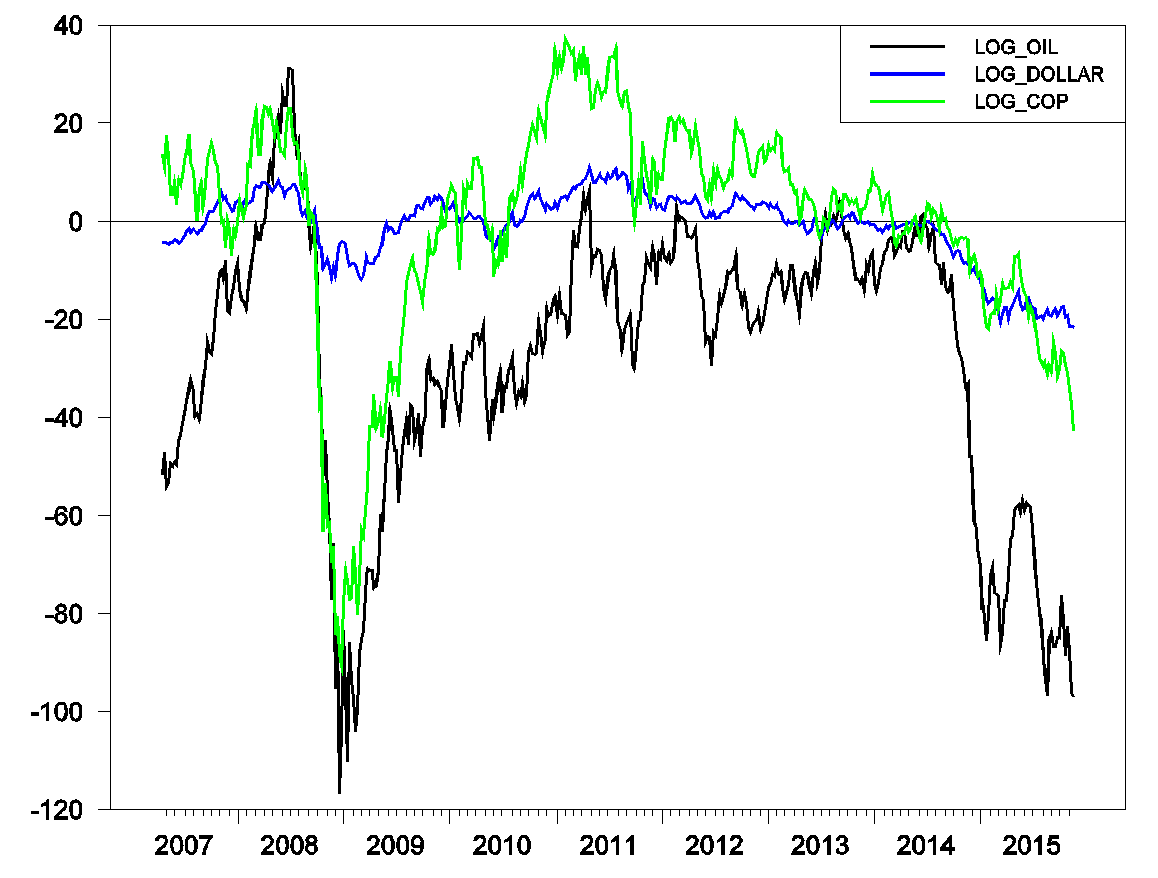
Here’s a graph over a longer period of the dollar price of oil, the
dollar price of copper, and the dollar price of a weighted average of
other countries’ currencies with weights based on the volume of trade
between the U.S. and each country. The graph is plotted on a logarithmic
basis, so for small changes the height of each series corresponds to
the percent difference between the price at the indicated date and the
price at the end of June 2014 (see my primer on the use of logarithms in economics
if you’re curious about those statements or why it might be helpful to
plot series this way). The plunge down in all three measures since June
2014 that was highlighted in the first set of graphs is seen to be a
broader pattern of striking positive co-movements among these variables.
Price of West Texas Intermediate (black), copper (green), and inverse of trade-weighted value of the dollar
(blue), end of week values April 20, 2007 to November 20, 2015. Graph
plots 100 times the difference between the natural logarithm at the
indicated date and the natural logarithm on June 27, 2014. A value for
the blue series below zero means that the dollar was worth more on that
date than it had been on June 27, 2014.
One would expect that when the dollar price of other countries’
currencies falls, so would the dollar price of internationally traded
commodities. But it is a mistake to say that the exchange rate is the
cause of the change in commodity prices. The reason is that exchange
rates and commodity prices are jointly determined as the outcome of
other forces. Depending on what those other forces are, one might see
stronger or weaker co-movement between commodity prices and exchange
rates.
For example, the most striking episode in the graph above is the
Great Recession in 2008-2009. Falling GDP around the world meant falling
demand for commodities. It was also associated with a flight to safety
in capital markets, which showed up as a surge in the value of the
dollar. It’s not the case that the strong dollar then was the cause of
falling dollar prices of oil and copper. Instead, the Great Recession
was itself the common cause behind movements in all three variables.
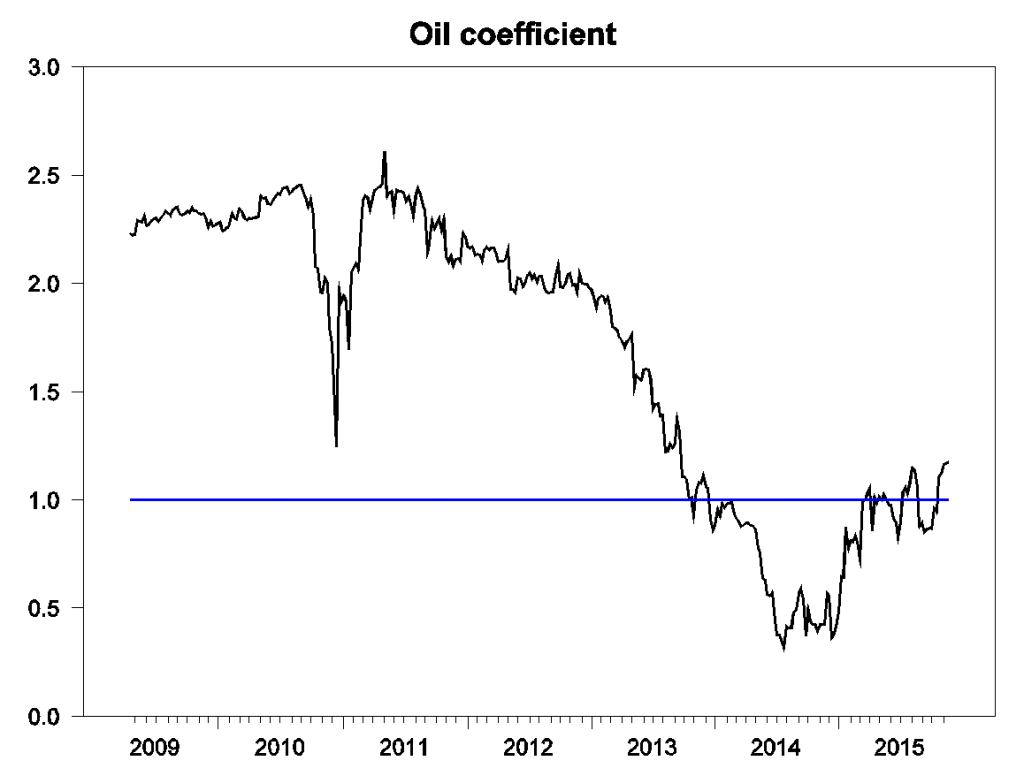
One way to get a sense of how the driving factors have changed over
time is to look at a regression of the weekly logarithmic change
(approximately the weekly percentage change)
of the dollar price of oil on the weekly logarithmic change in the
exchange rate using a rolling 2-year window. Each point in the graph
below plots that estimated coefficient using a sample of two years’ data
ending at the indicated date. The coefficient was above two during and
after the Great Recession– if the dollar appreciated 1% during the week
in that period, you would expect to see more than a 2% decline in oil
prices. The coefficient fell below one in the first half of 2014 but has
since risen back above one.
I had been giving a similar interpretation to the correlation since
June 2014 as to the data from the Great Recession– news about weakness
in the world economy seemed to be a key reason for strength of the
dollar over the last year and a half, and would also be a reason for
declining commodity prices.
However, developments of the last three weeks call for a different explanation. The October 28 FOMC statement and subsequent statements by Fed officials
have made clear that a hike in U.S. interest rates is coming December
16. An increase in U.S. interest rates relative to our trading partners
is the primary reason that the dollar appreciated 4% (logarithmically)
since October 16. Over that same period the dollar price of oil and
copper each fell 16%....MORE